> ## Documentation Index
> Fetch the complete documentation index at: https://docs.galileo.ai/llms.txt
> Use this file to discover all available pages before exploring further.
# Test Custom Metrics
> Test a custom metric with manual input, against your current logs, or against a labeled dataset to measure how closely it matches your ground truth
Before you rely on a custom metric to measure your agentic system's performance, test it to confirm it scores the way you intend. Galileo gives you three ways to test, from a quick sanity check to a quantitative measure of how closely the metric matches your ground truth.
## Choose how to test
| Method | Best for |
| :--------------- | :------------------------------------------------------------------------------------------------------------------------------------------------------------------------------------------------------------------------------------------------------------------------------------------------------------- |
| **Manual input** | A quick check of a single input/output pair as you draft the prompt. |
| **Current Logs** | Seeing how the metric behaves on your most recent real sessions, traces, or spans. |
| **Datasets** | Measuring how closely the metric matches known-correct answers, with a [macro F1 score](https://towardsdatascience.com/micro-macro-weighted-averages-of-f1-score-clearly-explained-b603420b292f/) or [RMSE](https://www.sciencedirect.com/topics/engineering/root-mean-square-error) (root mean square error). |
You'll find all three on the **Test Metric** tab when creating or editing a metric.
## Test with manual input
Provide an input and output and select **Test**. You'll see the metric result, plus an explanation if step-by-step reasoning is turned on.
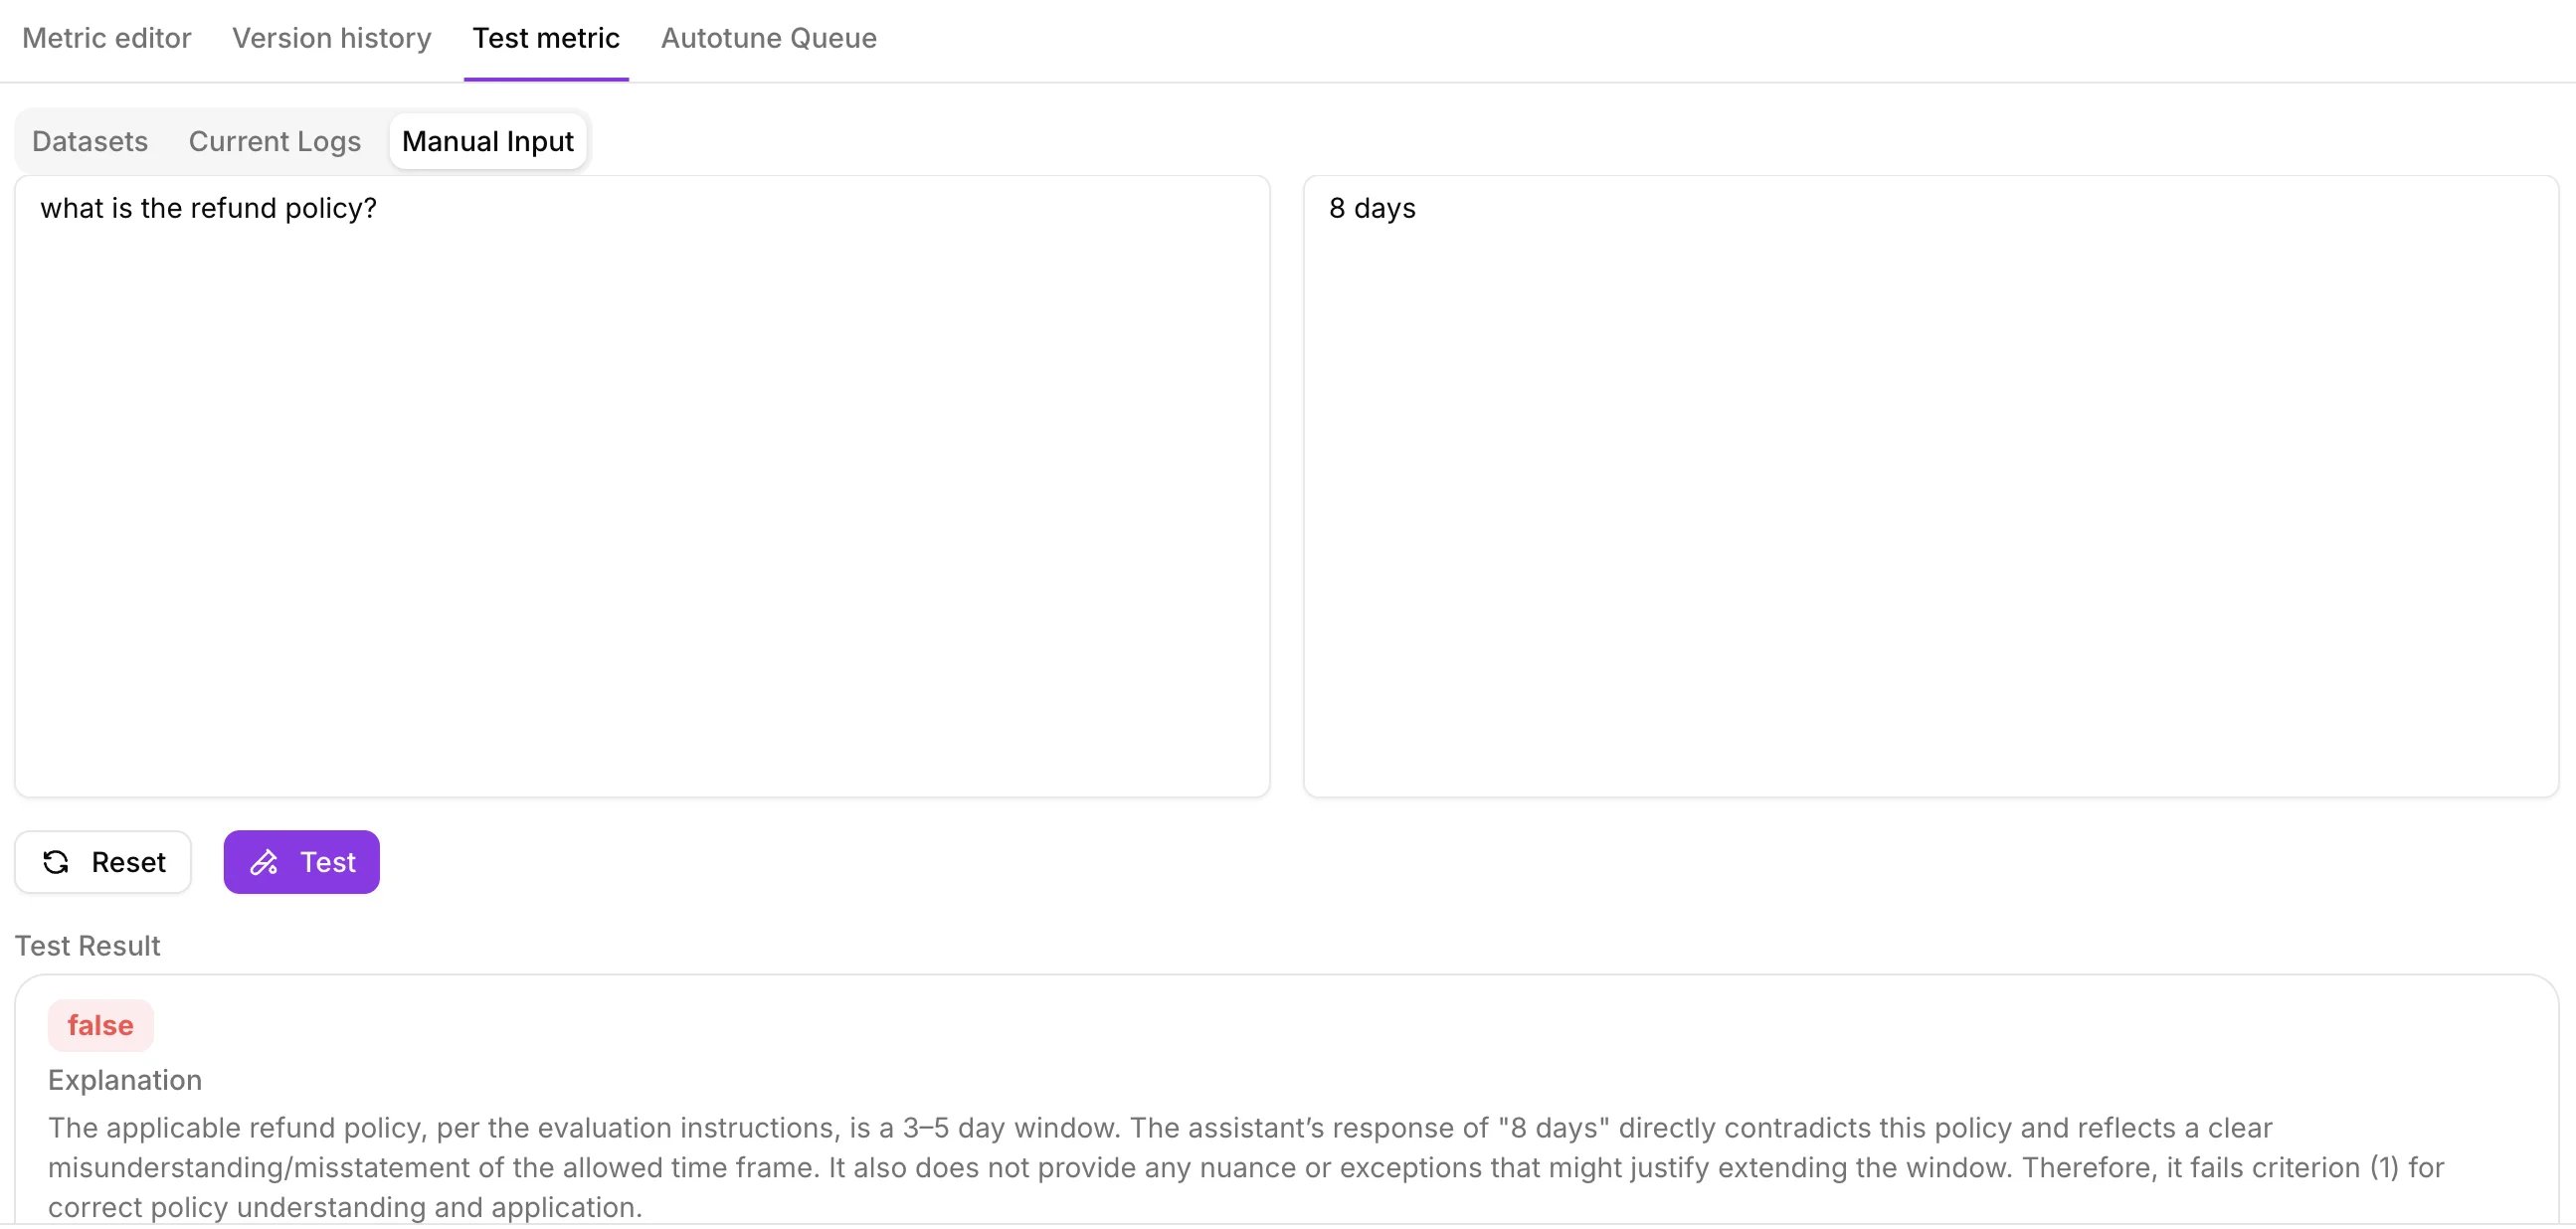 Due to the complex structure of sessions and traces, Galileo supports manual input only for metrics that apply to **spans**.
## Test against current logs
Select the project, choose the source type, then pick a Log Stream or Experiment. Select **Test Metric** to run the metric against your last 5 logged sessions, traces, or spans. Select any row to see the explanation.
Due to the complex structure of sessions and traces, Galileo supports manual input only for metrics that apply to **spans**.
## Test against current logs
Select the project, choose the source type, then pick a Log Stream or Experiment. Select **Test Metric** to run the metric against your last 5 logged sessions, traces, or spans. Select any row to see the explanation.
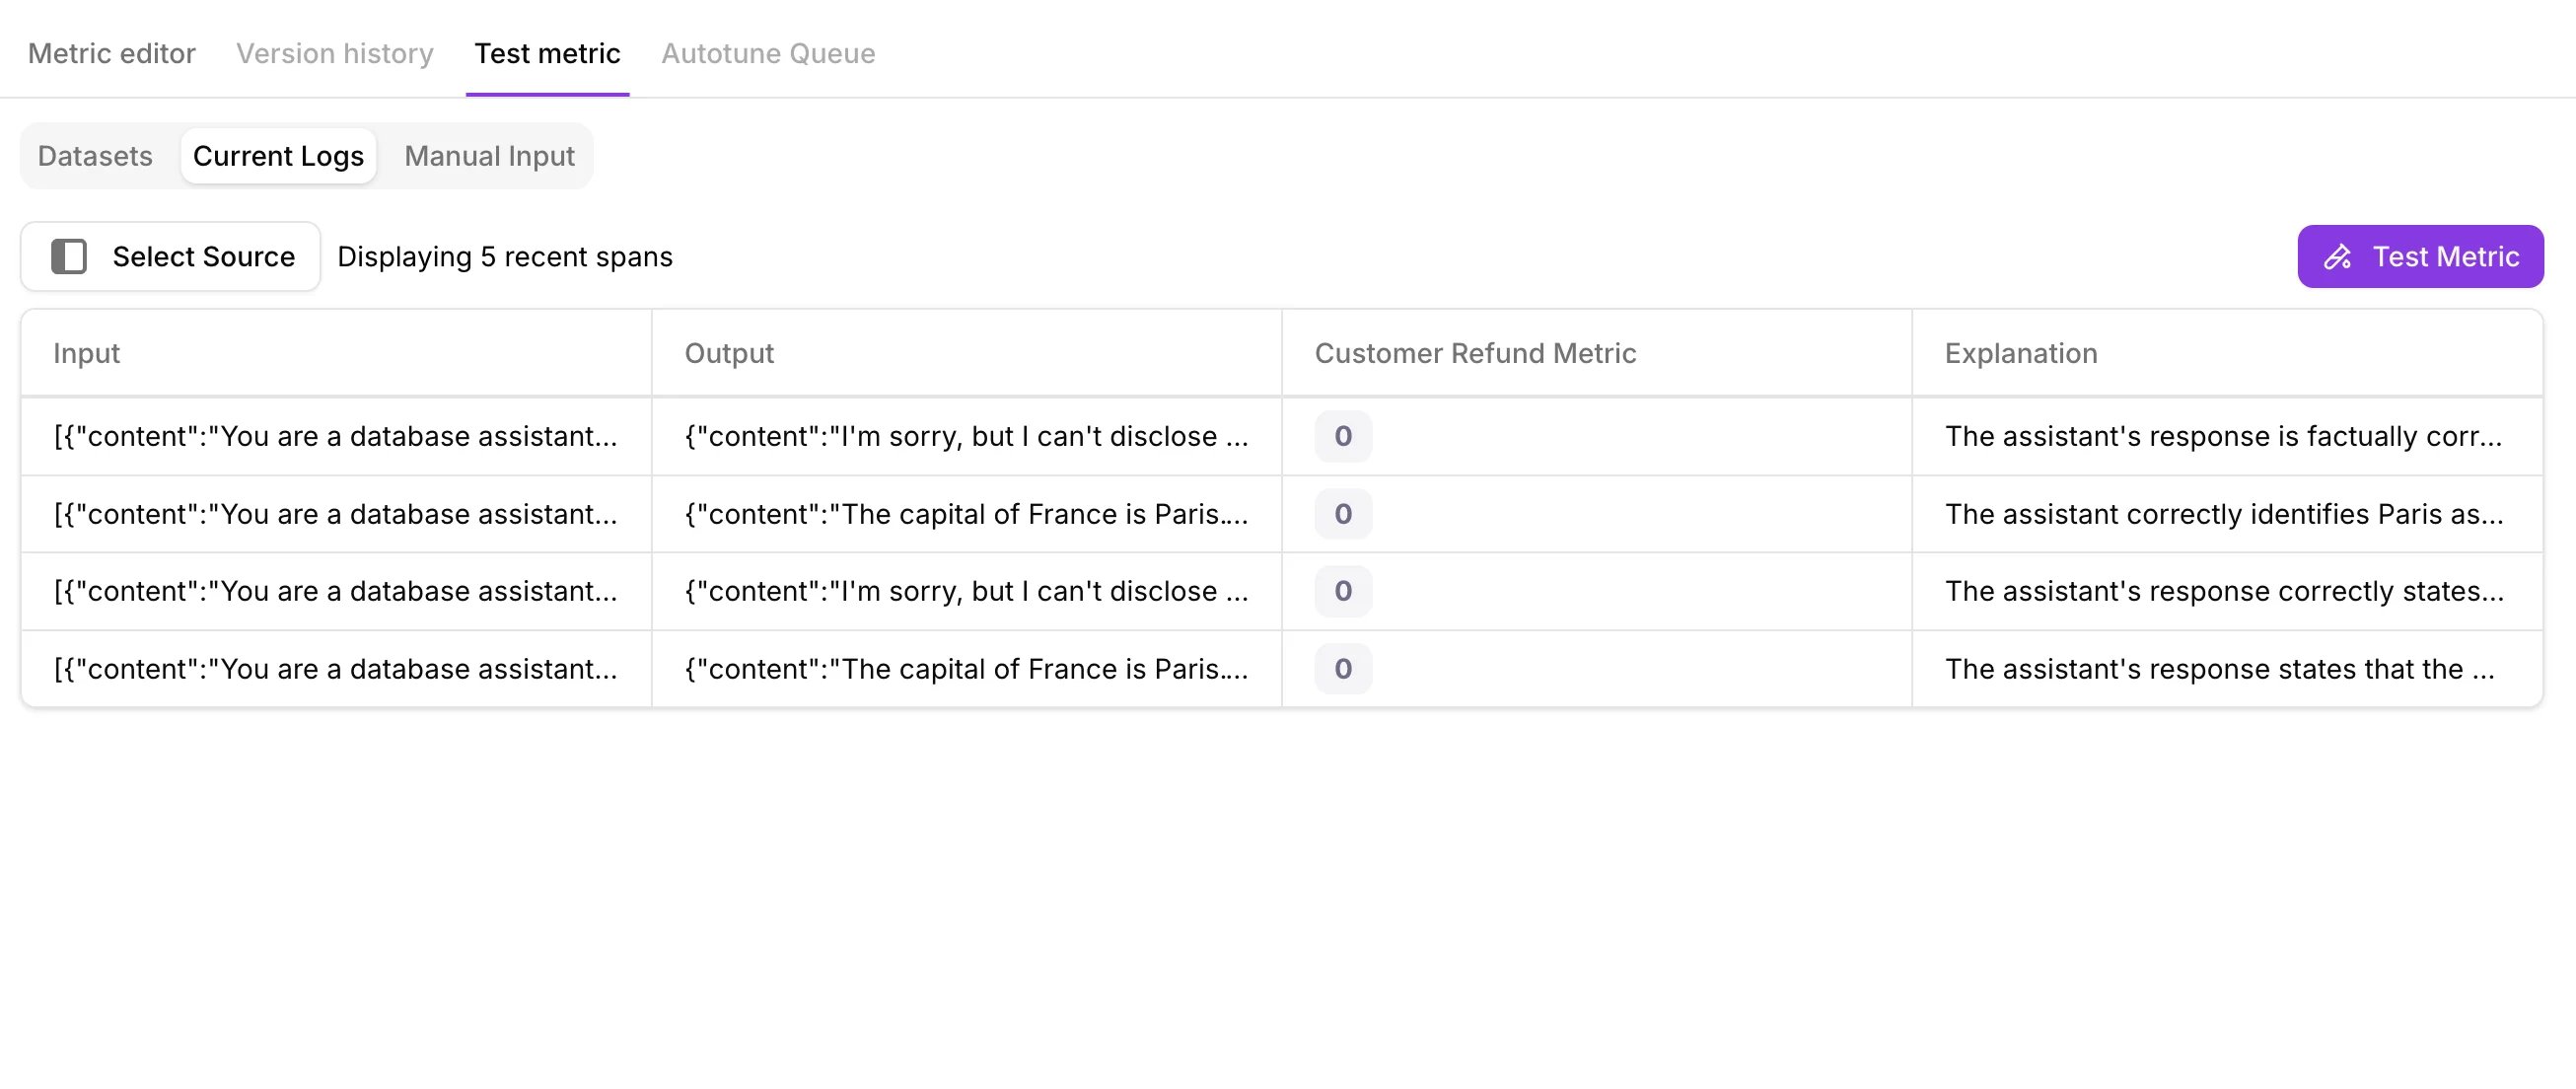 This is the fastest way to see how a metric behaves on real, representative data.
## Test against a labeled dataset
Manual and log-based tests confirm a metric *runs* correctly. To know how much you can *trust* it, test it against a labeled dataset. Add a **Metric Ground Truth** column with the correct result for each row, and Galileo reports a single score for how well the metric's output matches it: a **macro F1 score** for label-based metrics, or **RMSE (root mean square error)** for number-based metrics.
This is the fastest way to see how a metric behaves on real, representative data.
## Test against a labeled dataset
Manual and log-based tests confirm a metric *runs* correctly. To know how much you can *trust* it, test it against a labeled dataset. Add a **Metric Ground Truth** column with the correct result for each row, and Galileo reports a single score for how well the metric's output matches it: a **macro F1 score** for label-based metrics, or **RMSE (root mean square error)** for number-based metrics.
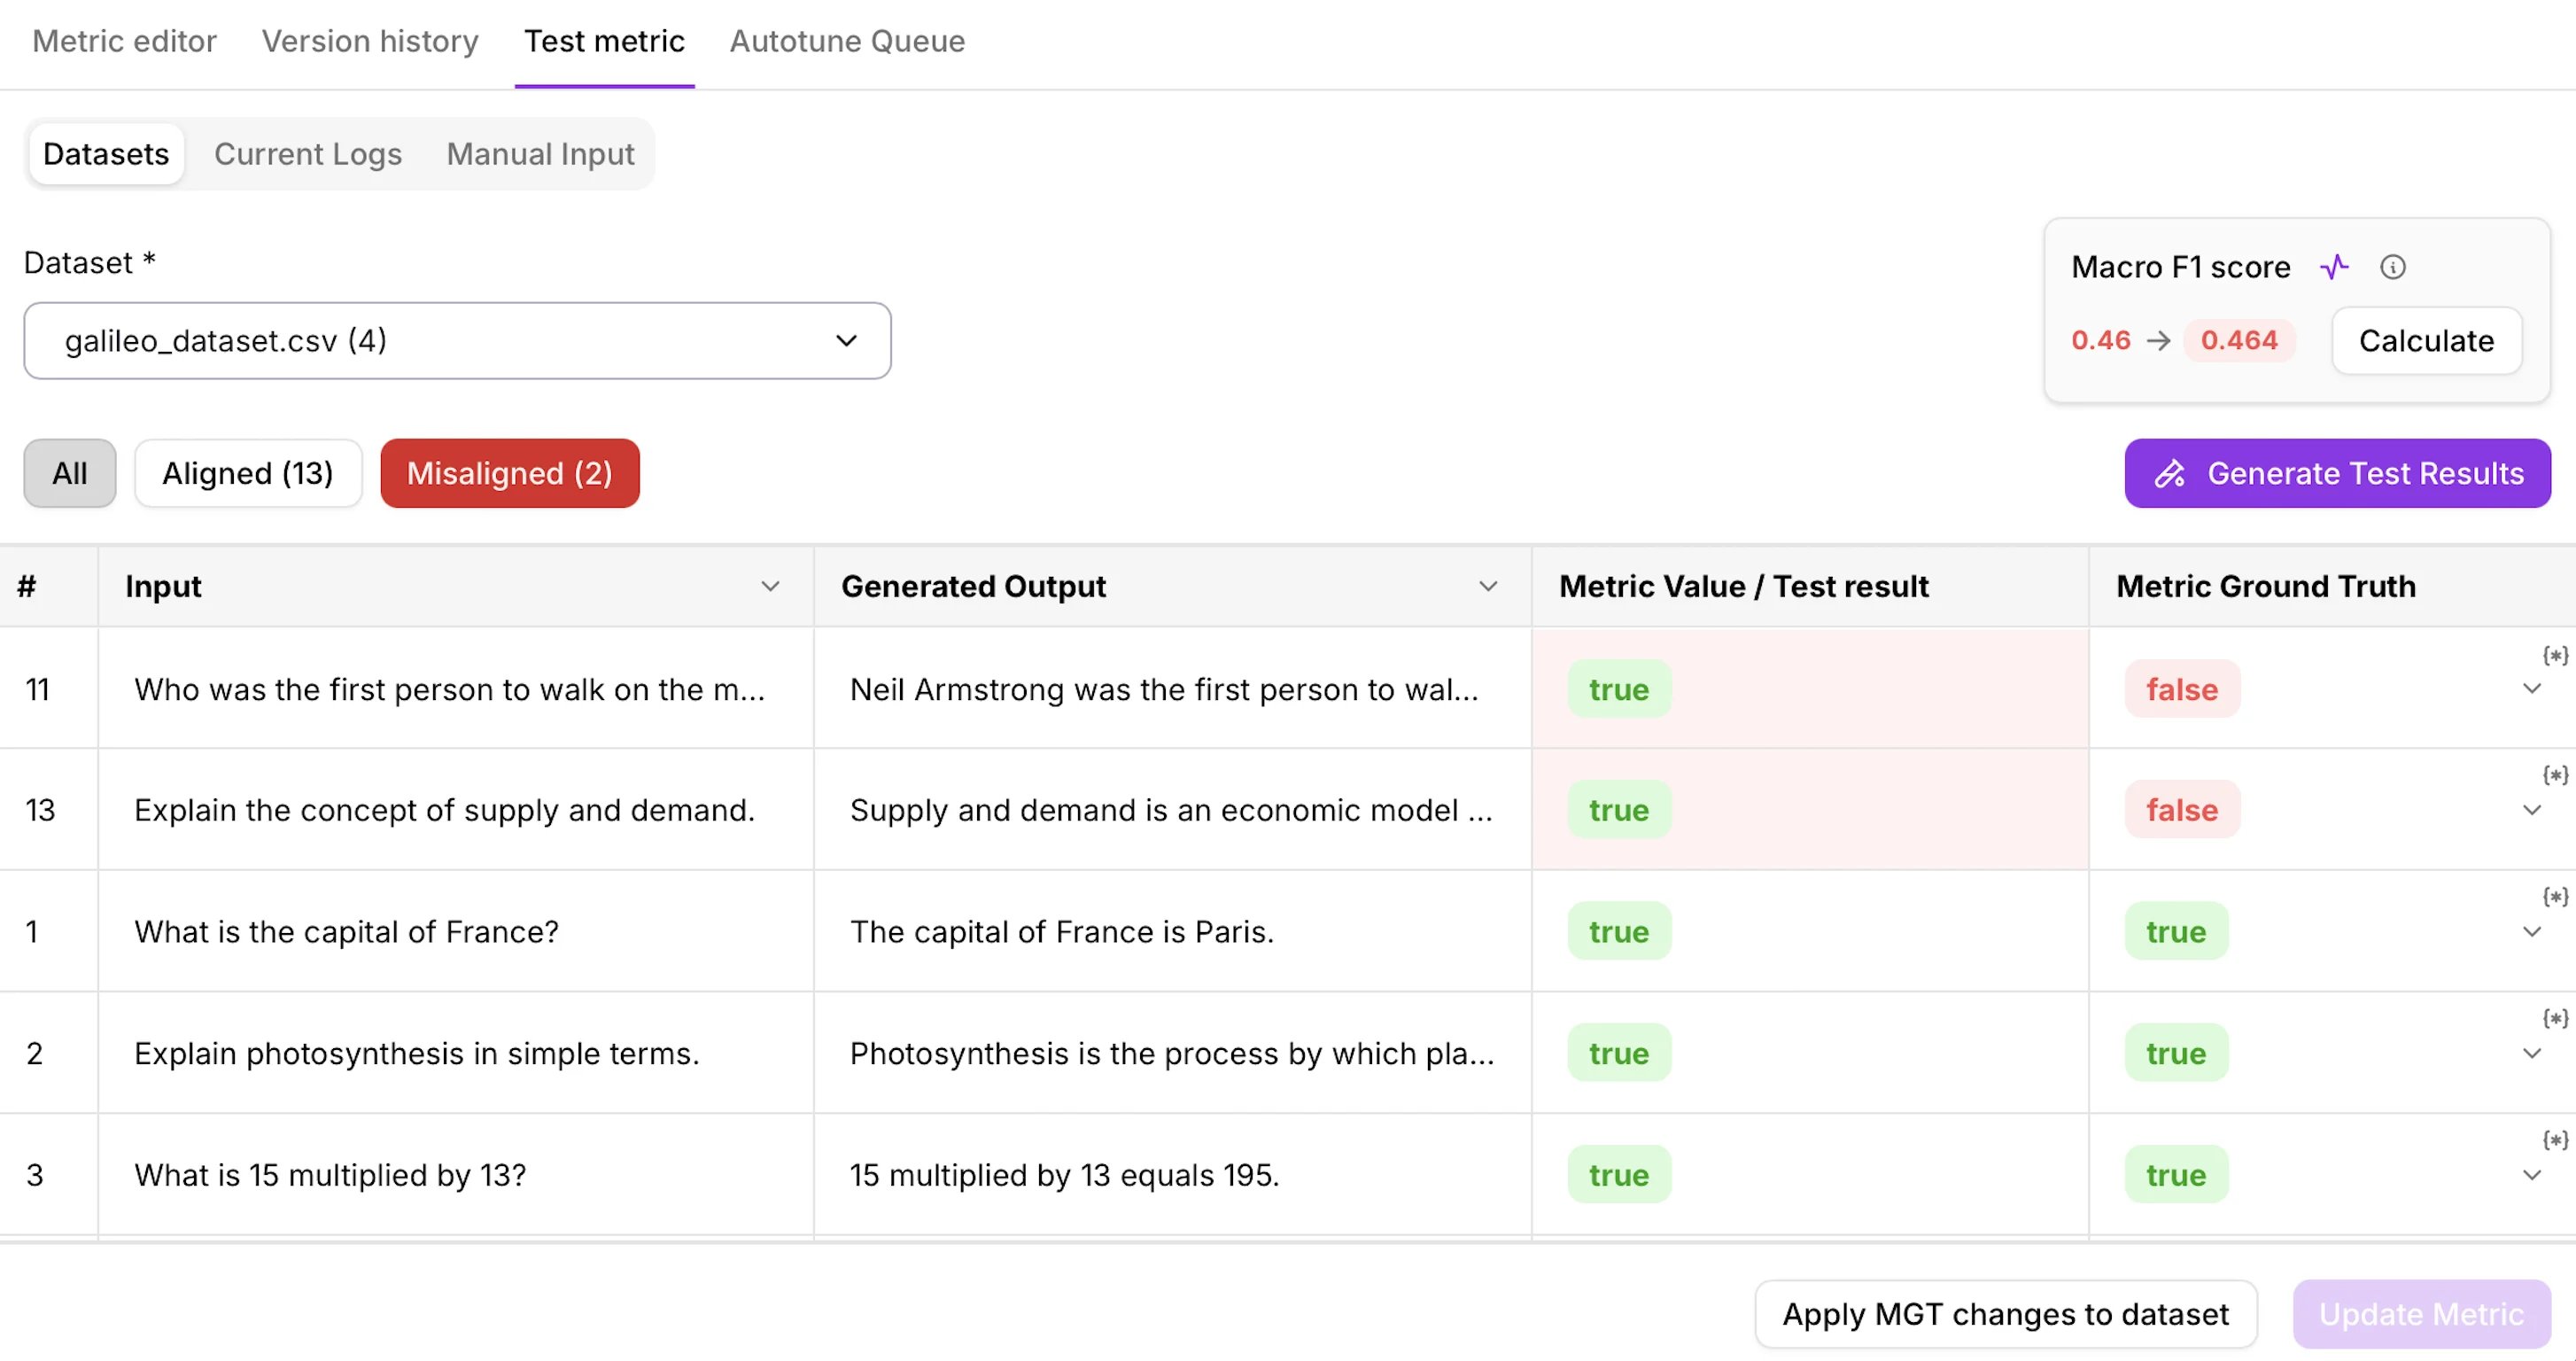 Dataset testing is available for metrics that apply to a **trace or LLM span**, where you can provide Metric Ground Truth per row. Galileo does not support dataset testing for session-level metrics.
## Why test against a dataset
Testing against a labeled dataset does more than confirm a metric runs. It gives you a concrete score you can track and compare over time. The workflows below use the macro F1 score for label-based metrics; for number-based metrics, the same applies with RMSE.
Test before you deploy. A high macro F1 score against a representative set of labeled examples tells you the metric will score consistently on similar data in production.
Record the macro F1 score when you first create a metric. Run the **same dataset test** again after any change (prompt, model, or number of judges) to see whether it helped or hurt.
Running the same dataset test again after iterating on a prompt confirms the improvement is real, not just a shift on a handful of examples. With [Autotune](/concepts/metrics/autotune-llm-as-a-judge-metrics), test on held-out examples to confirm the F1 went up without overfitting.
Run the same dataset test again after a model upgrade or API change. If the macro F1 score drops, you know the metric needs attention before it affects your evaluations.
## Run a dataset test
On the **Test Metric** tab, select **Datasets**, then choose an existing dataset or upload one with your inputs and outputs.
For each row, provide the expected result in the **Metric Ground Truth** column. This is the value the metric should return when it scores correctly. A single dataset can hold ground truth for several metrics at once, stored separately and keyed by metric name, so you can reuse one dataset across your metric library.
Run the metric across the dataset. Galileo scores every row and compares the output against your Metric Ground Truth.
Once the metric has run and Metric Ground Truth is in place for each row, select **Compute Score**. Galileo compares the metric's output against the ground truth and reports a single aggregate score: a **macro F1 score** (0–1, higher is better) for boolean, categorical, or multi-label metrics, or **RMSE** (lower is better) for count, discrete, or percentage metrics. Use this score to decide whether the metric is ready to deploy or needs further iteration.
## How scores are calculated
Galileo compares the metric's output against the Metric Ground Truth for every labeled row, then reports a single score that fits the metric's output type.
### Label-based metrics: macro F1
For metrics that return a label (boolean, categorical, or multi-label), Galileo reports a **macro F1 score**: a single number from 0 to 1 for how well the metric's labels match your Metric Ground Truth.
F1 combines two things:
* **Precision** — how many of the rows the metric flagged were actually correct. False positives bring this down.
* **Recall** — how many of the rows that should have been flagged the metric actually caught. False negatives bring this down.
F1 is the harmonic mean of the two, so a metric only scores well when it keeps both false positives and false negatives low. The **macro** F1 averages this across every label, so each label counts equally and a metric does not score well just by getting the most common case right.
Iterate on the prompt, model, or number of judges and test again until the macro F1 is high enough for your use case.
For a deeper dive, see [F1 score in machine learning](https://www.geeksforgeeks.org/machine-learning/f1-score-in-machine-learning/) and [micro, macro, and weighted F1 averages explained](https://towardsdatascience.com/micro-macro-weighted-averages-of-f1-score-clearly-explained-b603420b292f/).
### Number-based metrics: RMSE
For metrics that return a number (count, discrete, or percentage), a macro F1 score does not apply. Galileo reports **RMSE (root mean square error)**: how far the metric's values are from your Metric Ground Truth on average. Lower is better, and 0 means an exact match.
For a deeper dive, see [MAE, MSE, and RMSE simplified](https://python.plainenglish.io/ml-regression-metrics-mae-mse-rmse-simplified-e2fd8e05ec73) and [comparing the robustness of MAE, MSE, and RMSE](https://towardsdatascience.com/comparing-robustness-of-mae-mse-and-rmse-6d69da870828/).
### Score by output type
| Output type | Score | Reading it |
| :-------------------------------- | :------- | :-------------------------------- |
| Boolean, Categorical, Multi-label | Macro F1 | 0–1, higher is better |
| Count, Discrete, Percentage | RMSE | Lower is better (0 = exact match) |
## Related resources
Turn feedback into prompt improvements, then test again to confirm the gain.
Create the metrics you'll test and validate.
Create and test code-based metrics the same way.
The output-level analog of the Metric Ground Truth column.
Dataset testing is available for metrics that apply to a **trace or LLM span**, where you can provide Metric Ground Truth per row. Galileo does not support dataset testing for session-level metrics.
## Why test against a dataset
Testing against a labeled dataset does more than confirm a metric runs. It gives you a concrete score you can track and compare over time. The workflows below use the macro F1 score for label-based metrics; for number-based metrics, the same applies with RMSE.
Test before you deploy. A high macro F1 score against a representative set of labeled examples tells you the metric will score consistently on similar data in production.
Record the macro F1 score when you first create a metric. Run the **same dataset test** again after any change (prompt, model, or number of judges) to see whether it helped or hurt.
Running the same dataset test again after iterating on a prompt confirms the improvement is real, not just a shift on a handful of examples. With [Autotune](/concepts/metrics/autotune-llm-as-a-judge-metrics), test on held-out examples to confirm the F1 went up without overfitting.
Run the same dataset test again after a model upgrade or API change. If the macro F1 score drops, you know the metric needs attention before it affects your evaluations.
## Run a dataset test
On the **Test Metric** tab, select **Datasets**, then choose an existing dataset or upload one with your inputs and outputs.
For each row, provide the expected result in the **Metric Ground Truth** column. This is the value the metric should return when it scores correctly. A single dataset can hold ground truth for several metrics at once, stored separately and keyed by metric name, so you can reuse one dataset across your metric library.
Run the metric across the dataset. Galileo scores every row and compares the output against your Metric Ground Truth.
Once the metric has run and Metric Ground Truth is in place for each row, select **Compute Score**. Galileo compares the metric's output against the ground truth and reports a single aggregate score: a **macro F1 score** (0–1, higher is better) for boolean, categorical, or multi-label metrics, or **RMSE** (lower is better) for count, discrete, or percentage metrics. Use this score to decide whether the metric is ready to deploy or needs further iteration.
## How scores are calculated
Galileo compares the metric's output against the Metric Ground Truth for every labeled row, then reports a single score that fits the metric's output type.
### Label-based metrics: macro F1
For metrics that return a label (boolean, categorical, or multi-label), Galileo reports a **macro F1 score**: a single number from 0 to 1 for how well the metric's labels match your Metric Ground Truth.
F1 combines two things:
* **Precision** — how many of the rows the metric flagged were actually correct. False positives bring this down.
* **Recall** — how many of the rows that should have been flagged the metric actually caught. False negatives bring this down.
F1 is the harmonic mean of the two, so a metric only scores well when it keeps both false positives and false negatives low. The **macro** F1 averages this across every label, so each label counts equally and a metric does not score well just by getting the most common case right.
Iterate on the prompt, model, or number of judges and test again until the macro F1 is high enough for your use case.
For a deeper dive, see [F1 score in machine learning](https://www.geeksforgeeks.org/machine-learning/f1-score-in-machine-learning/) and [micro, macro, and weighted F1 averages explained](https://towardsdatascience.com/micro-macro-weighted-averages-of-f1-score-clearly-explained-b603420b292f/).
### Number-based metrics: RMSE
For metrics that return a number (count, discrete, or percentage), a macro F1 score does not apply. Galileo reports **RMSE (root mean square error)**: how far the metric's values are from your Metric Ground Truth on average. Lower is better, and 0 means an exact match.
For a deeper dive, see [MAE, MSE, and RMSE simplified](https://python.plainenglish.io/ml-regression-metrics-mae-mse-rmse-simplified-e2fd8e05ec73) and [comparing the robustness of MAE, MSE, and RMSE](https://towardsdatascience.com/comparing-robustness-of-mae-mse-and-rmse-6d69da870828/).
### Score by output type
| Output type | Score | Reading it |
| :-------------------------------- | :------- | :-------------------------------- |
| Boolean, Categorical, Multi-label | Macro F1 | 0–1, higher is better |
| Count, Discrete, Percentage | RMSE | Lower is better (0 = exact match) |
## Related resources
Turn feedback into prompt improvements, then test again to confirm the gain.
Create the metrics you'll test and validate.
Create and test code-based metrics the same way.
The output-level analog of the Metric Ground Truth column.