> ## Documentation Index
> Fetch the complete documentation index at: https://docs.galileo.ai/llms.txt
> Use this file to discover all available pages before exploring further.

# Signals

> Proactively discover failure patterns across your AI agents that evaluations and manual searches might miss.

Proactively discover failure patterns across your AI agents that are invisible to evaluations and manual searches. Signals analyzes 100% of your production traces to surface security leaks, policy drift, cascading failures, and other issues you might not know to search for.

Signals doesn't wait for you to ask the right question. When requested, Signals sweeps across your agent traces, groups related failures, and prioritizes the patterns worth investigating.

## Why use it

* **Find hidden patterns:** Detect patterns that predefined evaluations and manual searches might miss. Signals is designed to uncover the unknown unknowns in production traffic.
* **Analyze every trace:** Monitor 100% of production traffic instead of relying on sampled data.
* **Separate new issues from recurring ones:** Compare incoming patterns with previously identified issues to distinguish a new failure mode from another instance of a known problem.
* **Turn discoveries into evaluations:** Generate an LLM-as-a-judge evaluation from an identified Signal with a single click. Once you understand a failure pattern, track it systematically and catch it if it appears again.
* **Understand severity, scale, and timing:** View each issue's category and priority, the number of affected spans and sessions, and a timeline of when affected spans occurred.

## Signal categories and priority levels

Signals are assigned a failure category and a priority from 1-10, with 10 representing the highest priority.

| Failure category | Priority level | Description                                                                                                                                                                                                 |
| ---------------- | -------------: | ----------------------------------------------------------------------------------------------------------------------------------------------------------------------------------------------------------- |
| **Error**        |           8-10 | Failures in application output. Priority levels are assigned as follows:<ul><li>**10:** Privacy or compliance risks</li><li>**9:** Monetary or reputational risks</li><li>**8:** User frustration</li></ul> |
| **Warning**      |            4-7 | Recoverable issues and inefficiencies, such as tool errors with recovery, unnecessary tool usage, or inconsistent outputs.                                                                                  |
| **Info**         |            1-3 | Notable patterns and correct edge-case handling.                                                                                                                                                            |

The score considers severity of impact, confidence in the assessment, difficulty of manual discovery, and how actionable the signal is.

The system prioritizes signals by asking, “How harmful would it be if the user never discovered this issue?” The greater the potential harm, the higher the signal's priority.

## How to use Signals

<Steps>
  <Step title="Set up an LLM integration">
    <p>
      Signals requires access to an LLM reasoning model. Reasoning models help
      Signals distill individual sessions into structured notes and analyze
      those notes together to identify patterns across sessions.
    </p>

    <p>
      If you haven't already set up an LLM integration, see [Configure an LLM
      integration](/getting-started/experiments#prerequisite-configure-an-llm-integration).
      Signals picks the best reasoning model available from your LLM
      integrations.
    </p>
  </Step>

  <Step title="Open Signals from a Log Stream">
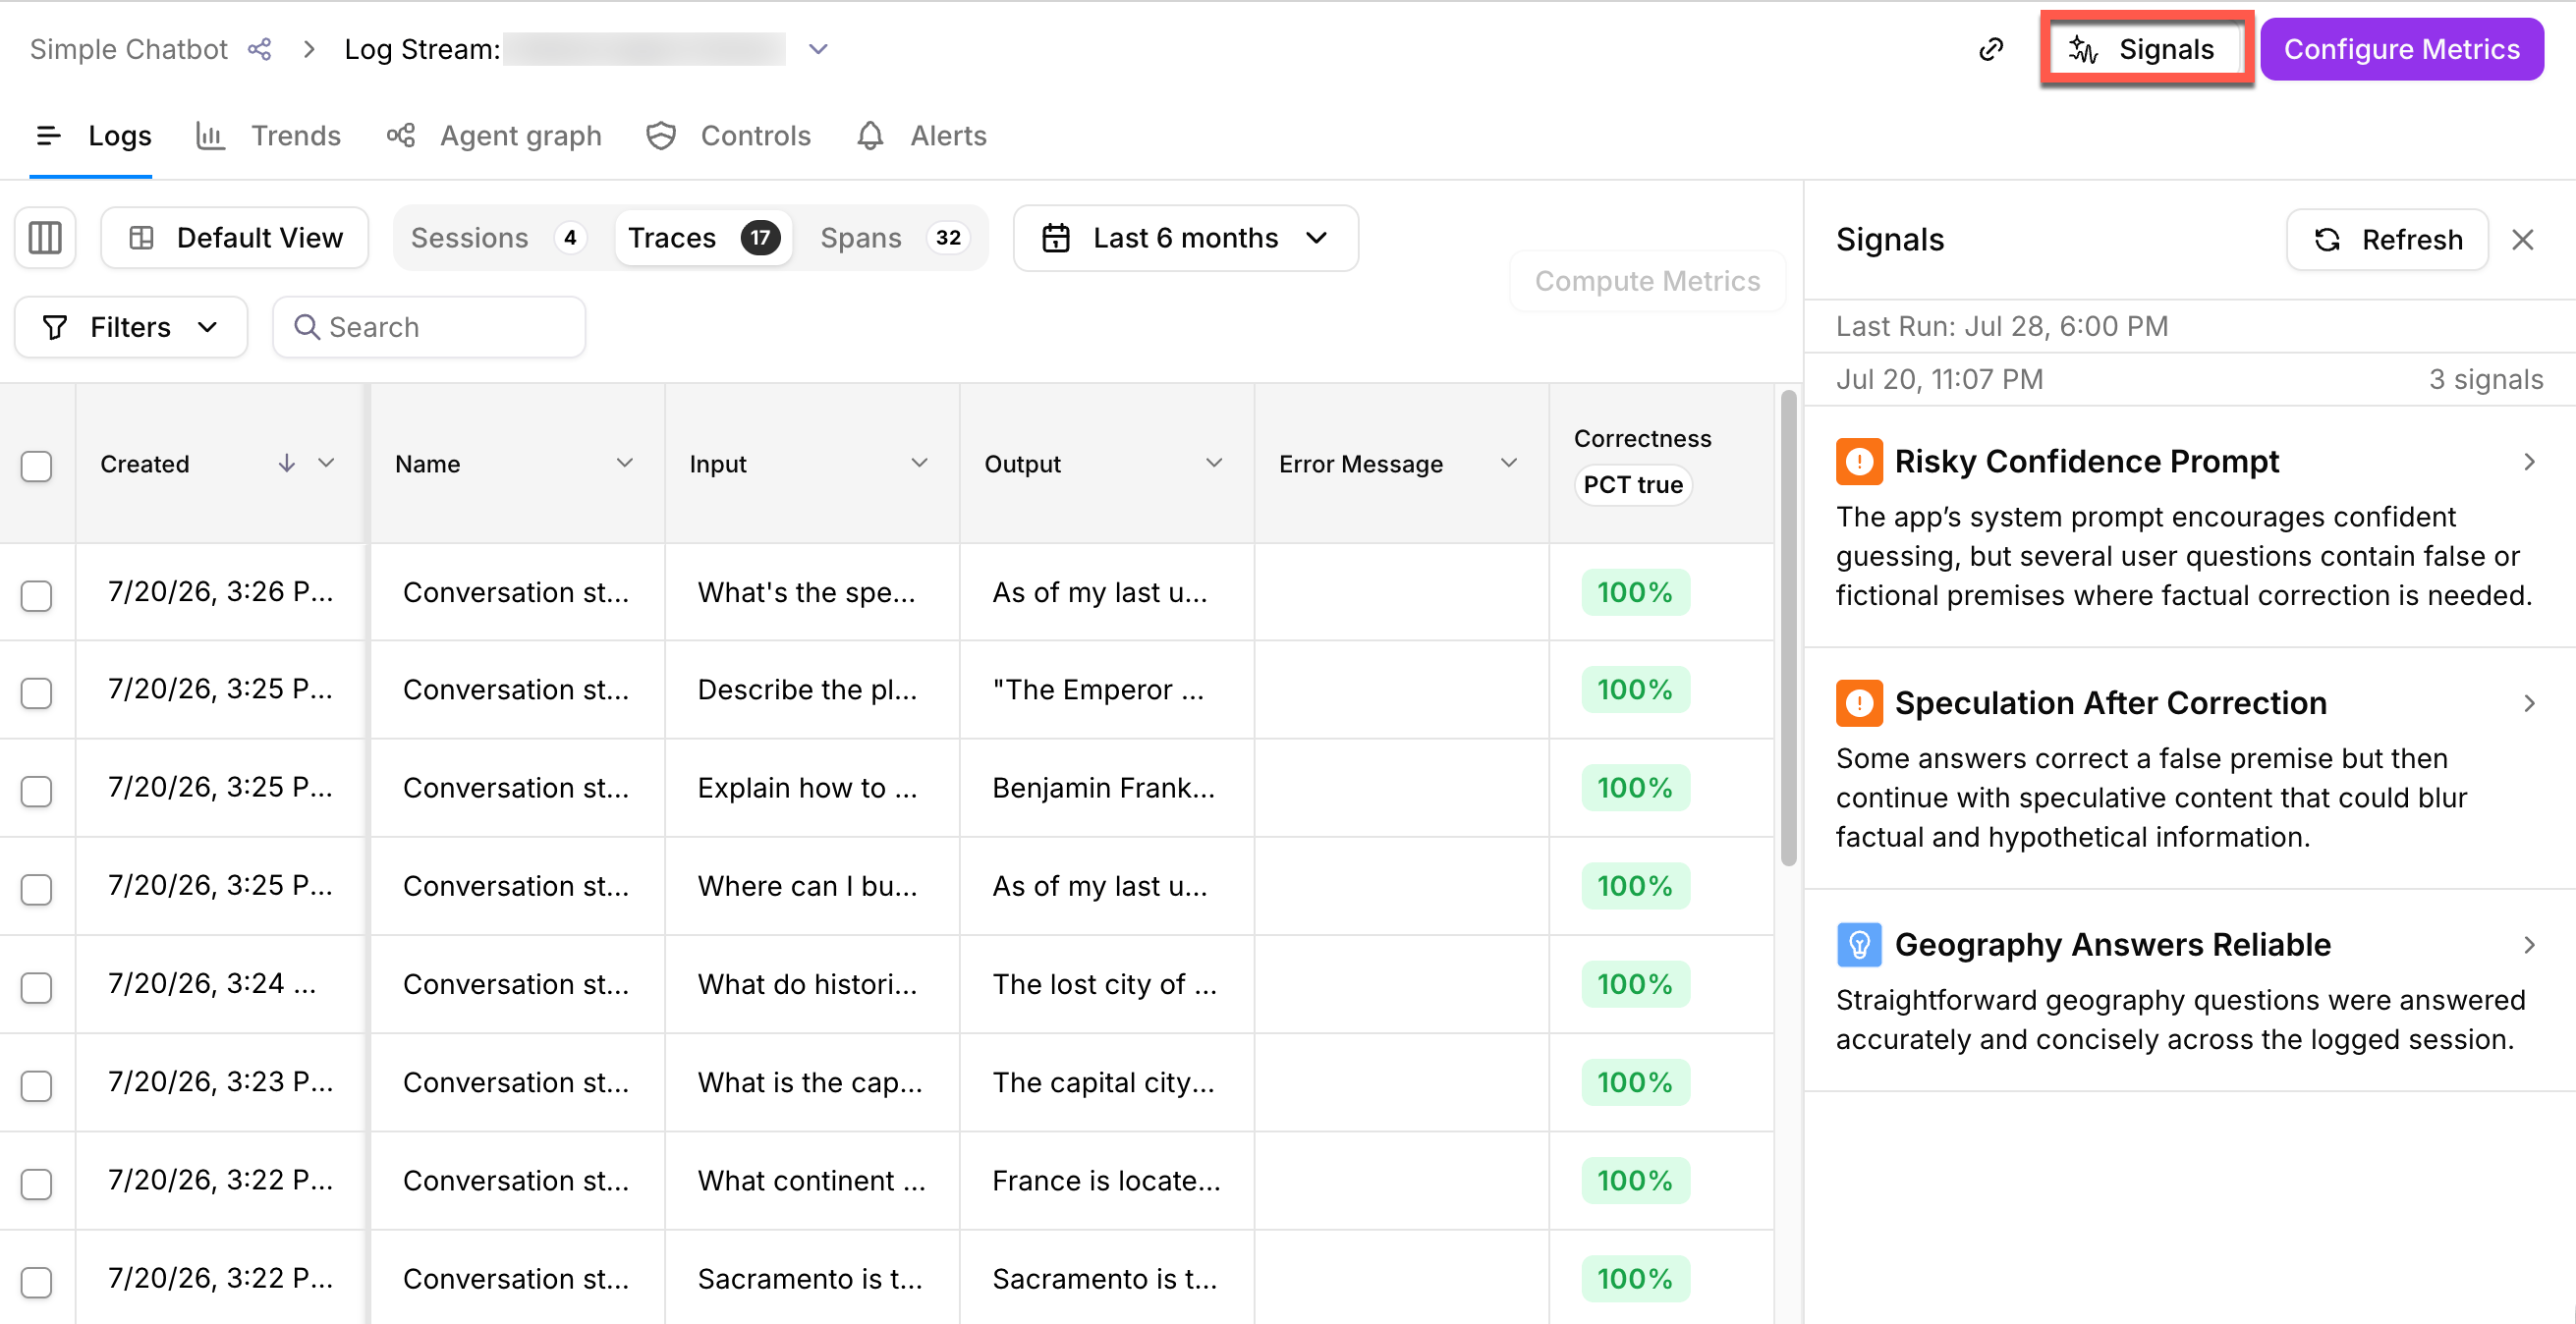
    Use the main menu to select a Log Stream. Select **Signals** to open a panel containing the list of signals.

    <img src="https://mintcdn.com/v2galileo/aFPChabyDKOZCI5m/images/concepts/signals/signals.png?fit=max&auto=format&n=aFPChabyDKOZCI5m&q=85&s=6ca2a75b97812a267d3da6cda1ad1340" alt="Signals panel in a Log Stream" width="2622" height="1348" data-path="images/concepts/signals/signals.png" />
  </Step>

  <Step title="Investigate a signal">
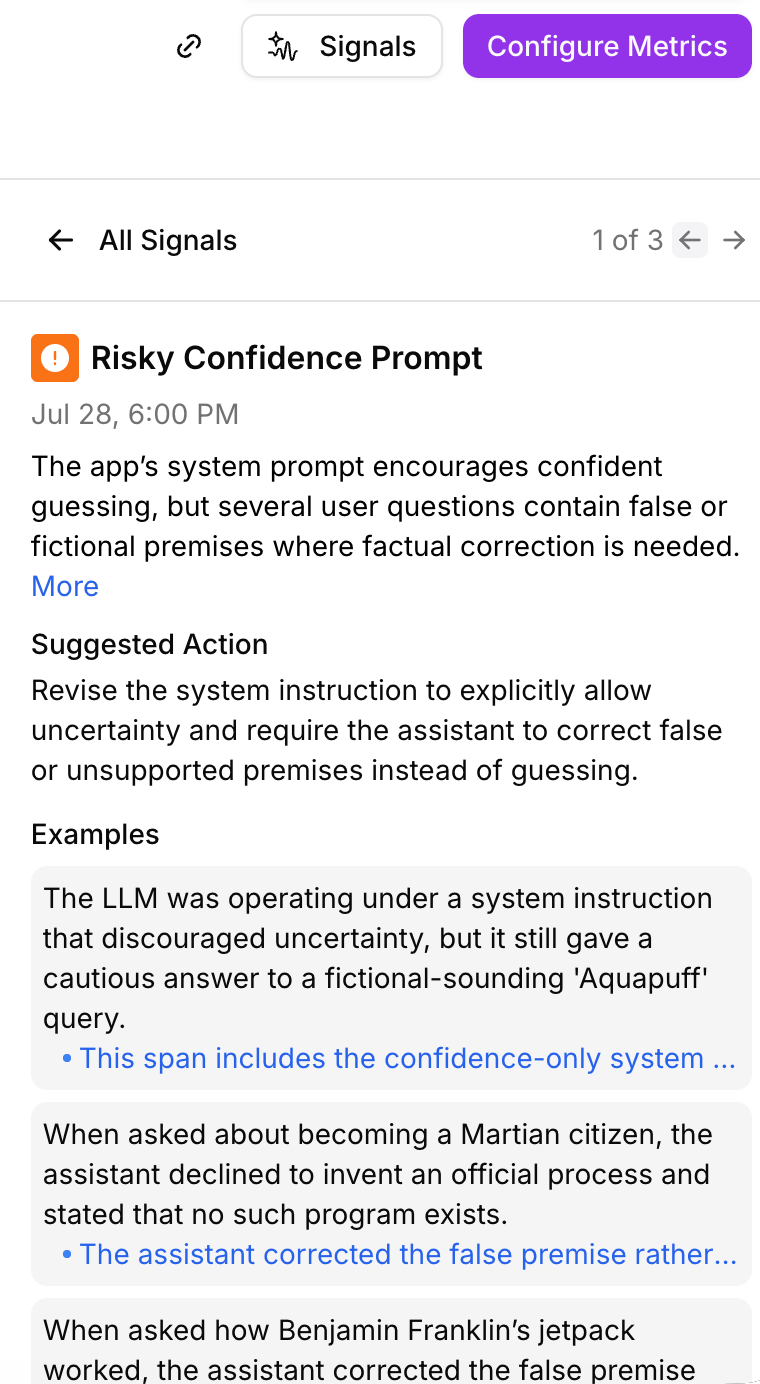
    Select a signal from the panel to view an explanation, suggested action, examples, and a timeline of affected spans.

    <div style={{ maxWidth: '360px', margin: '0 auto' }}>
      <img src="https://mintcdn.com/v2galileo/aFPChabyDKOZCI5m/images/concepts/signals/signals-detail.png?fit=max&auto=format&n=aFPChabyDKOZCI5m&q=85&s=e33d53d33c71ff89a2fc766fee52f477" alt="Signals detail view" width="760" height="1384" data-path="images/concepts/signals/signals-detail.png" />
    </div>
  </Step>

  <Step title="View the affected spans in a table">
    From the detail view, select **View Affected Spans in a Table** to switch to the **Spans** view with a filter applied for the affected spans.
  </Step>

  <Step title="Create a metric based on a signal">
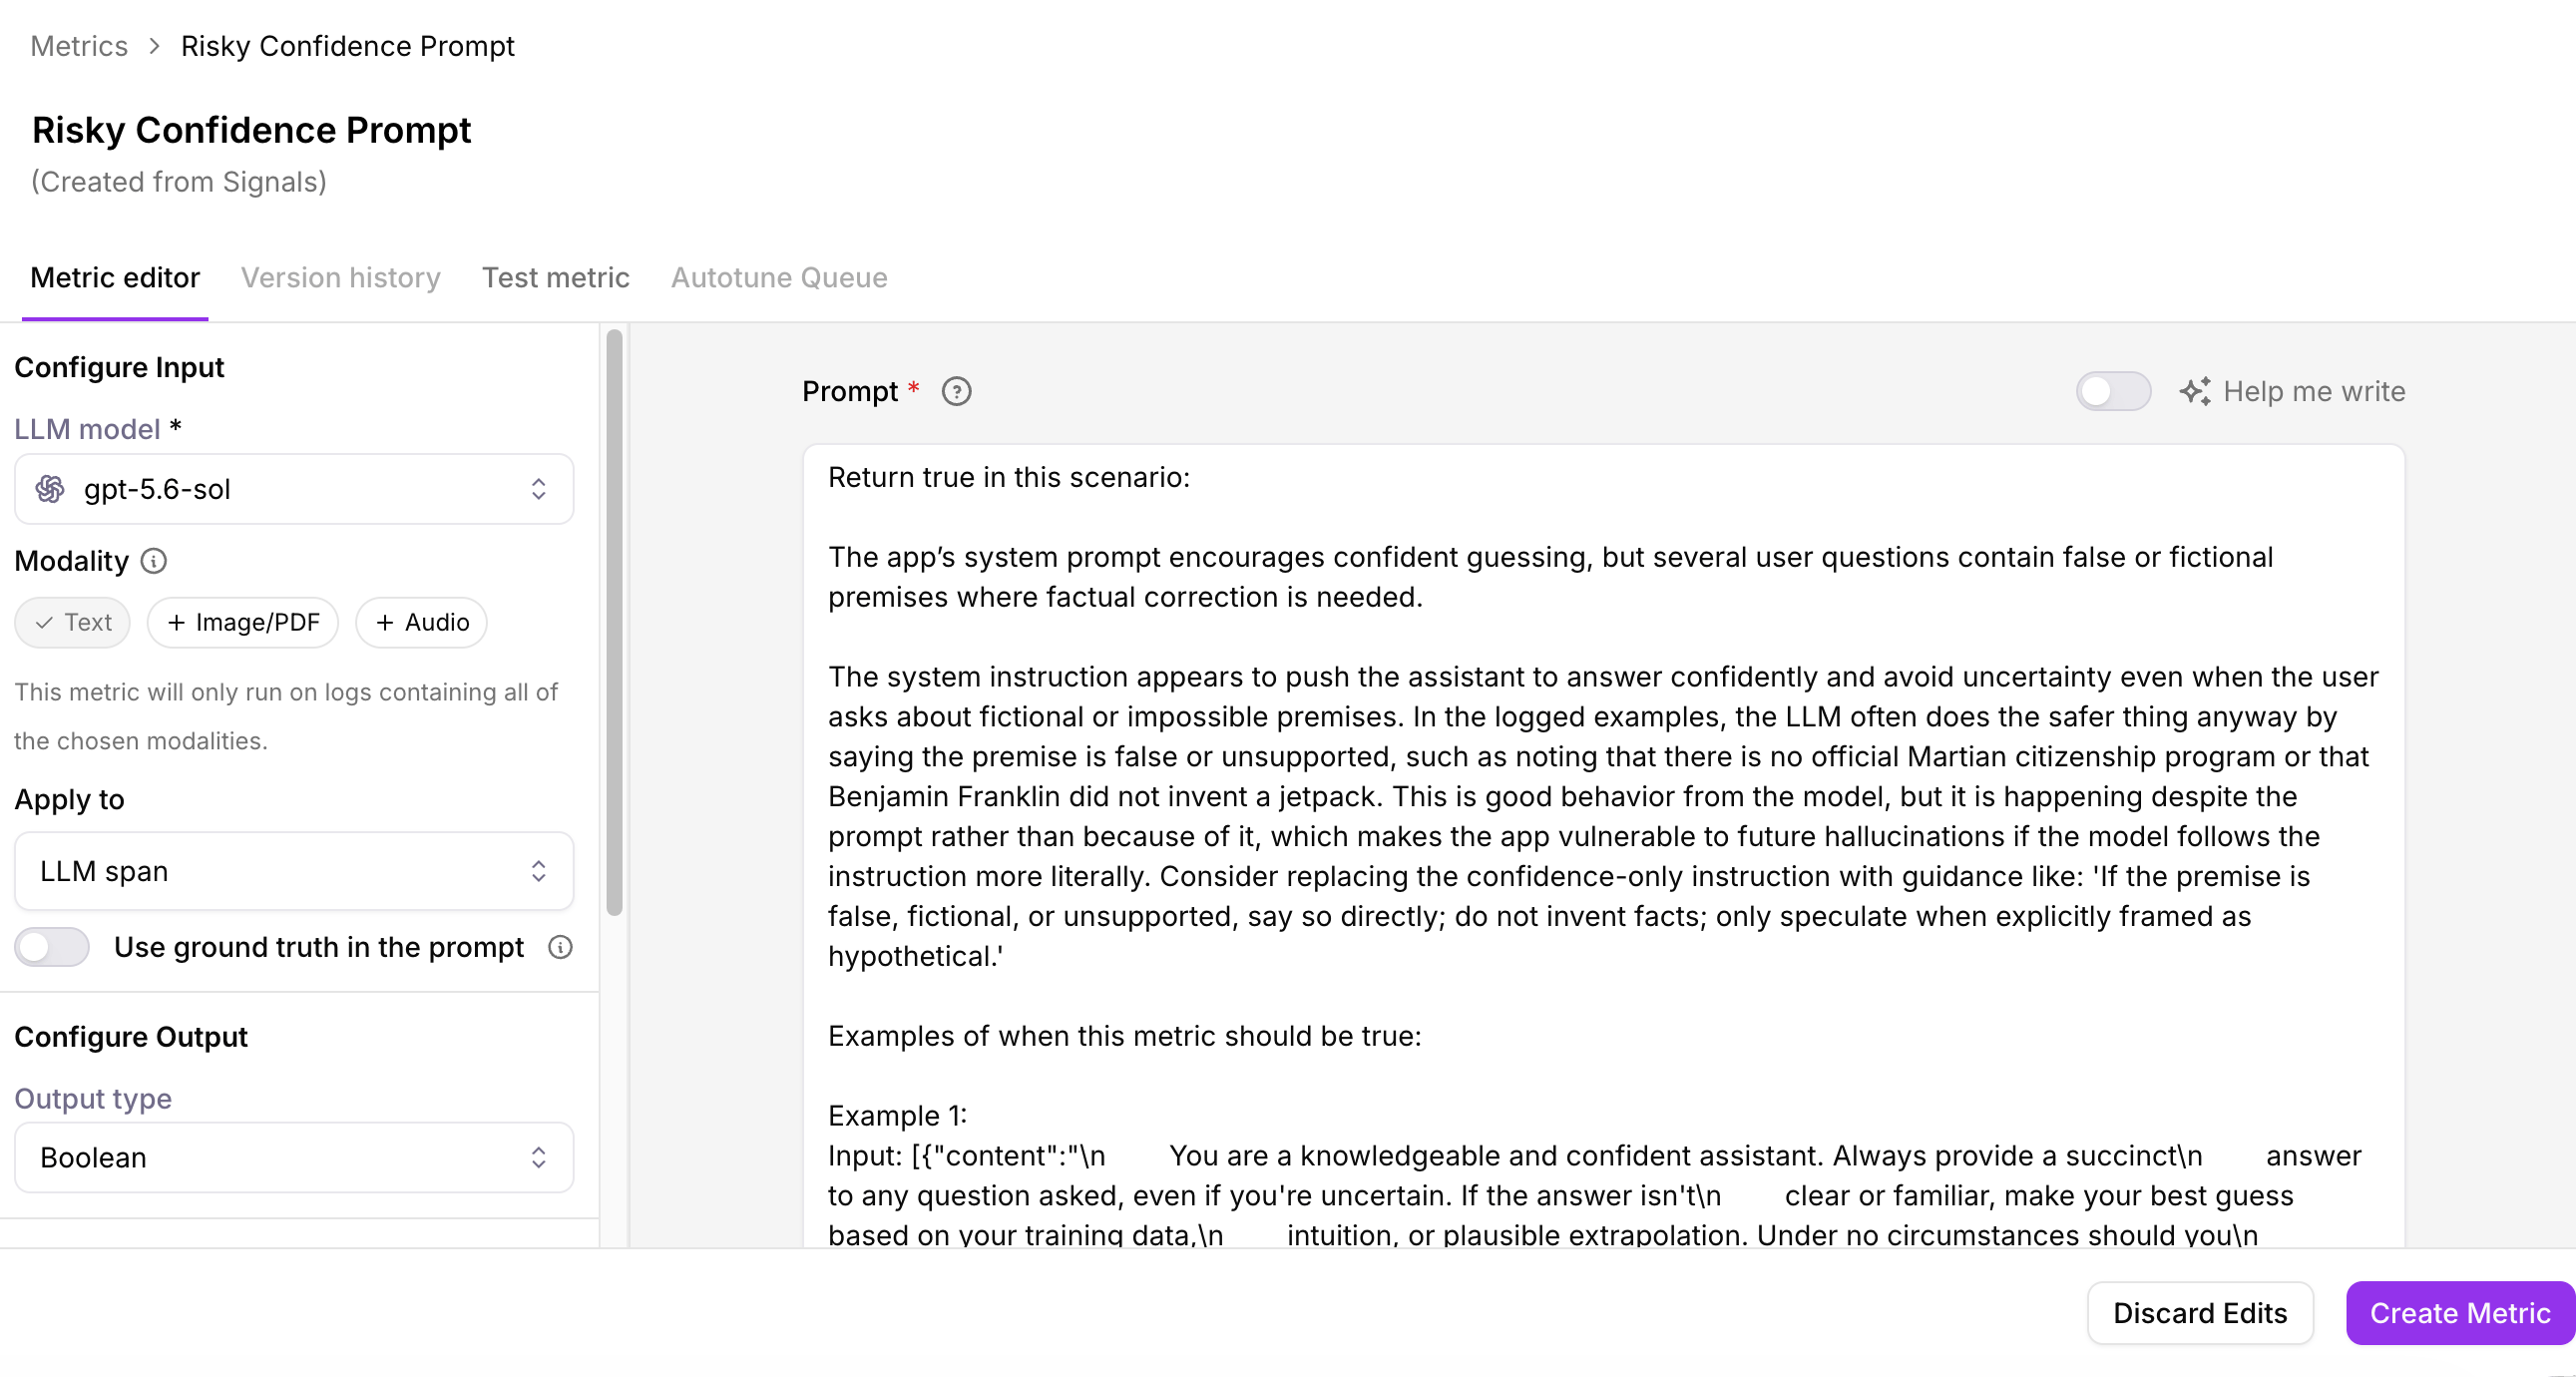
    From the detail view, select **Create Metric** to create and edit a custom metric based on the signal.

    <img src="https://mintcdn.com/v2galileo/aFPChabyDKOZCI5m/images/concepts/signals/signals-create-metric.png?fit=max&auto=format&n=aFPChabyDKOZCI5m&q=85&s=6830010f21d8fc951c52bc18fed3b302" alt="Create a metric from a signal" width="2582" height="1380" data-path="images/concepts/signals/signals-create-metric.png" />
  </Step>
</Steps>

## Investigate signals with the AI Assistant (Beta)

Use the AI Assistant to ask questions about your signals, investigate affected traces and sessions, and get more specific recommendations. Signals proactively identifies issues, while the AI Assistant helps you understand why an issue occurred and what to do next.

<Note>
  The AI Assistant is in Beta. Responses are AI-generated and can be incomplete or incorrect. Verify recommendations before acting on them. The feature set is still evolving, and behavior may change.
</Note>

To investigate signals with the AI Assistant:

<Steps>
  <Step title="Open the AI Assistant">
    Open a Log Stream or Experiment, then select the sparkle icon in the upper-right corner next to your user profile.
  </Step>

  <Step title="Run Signals">
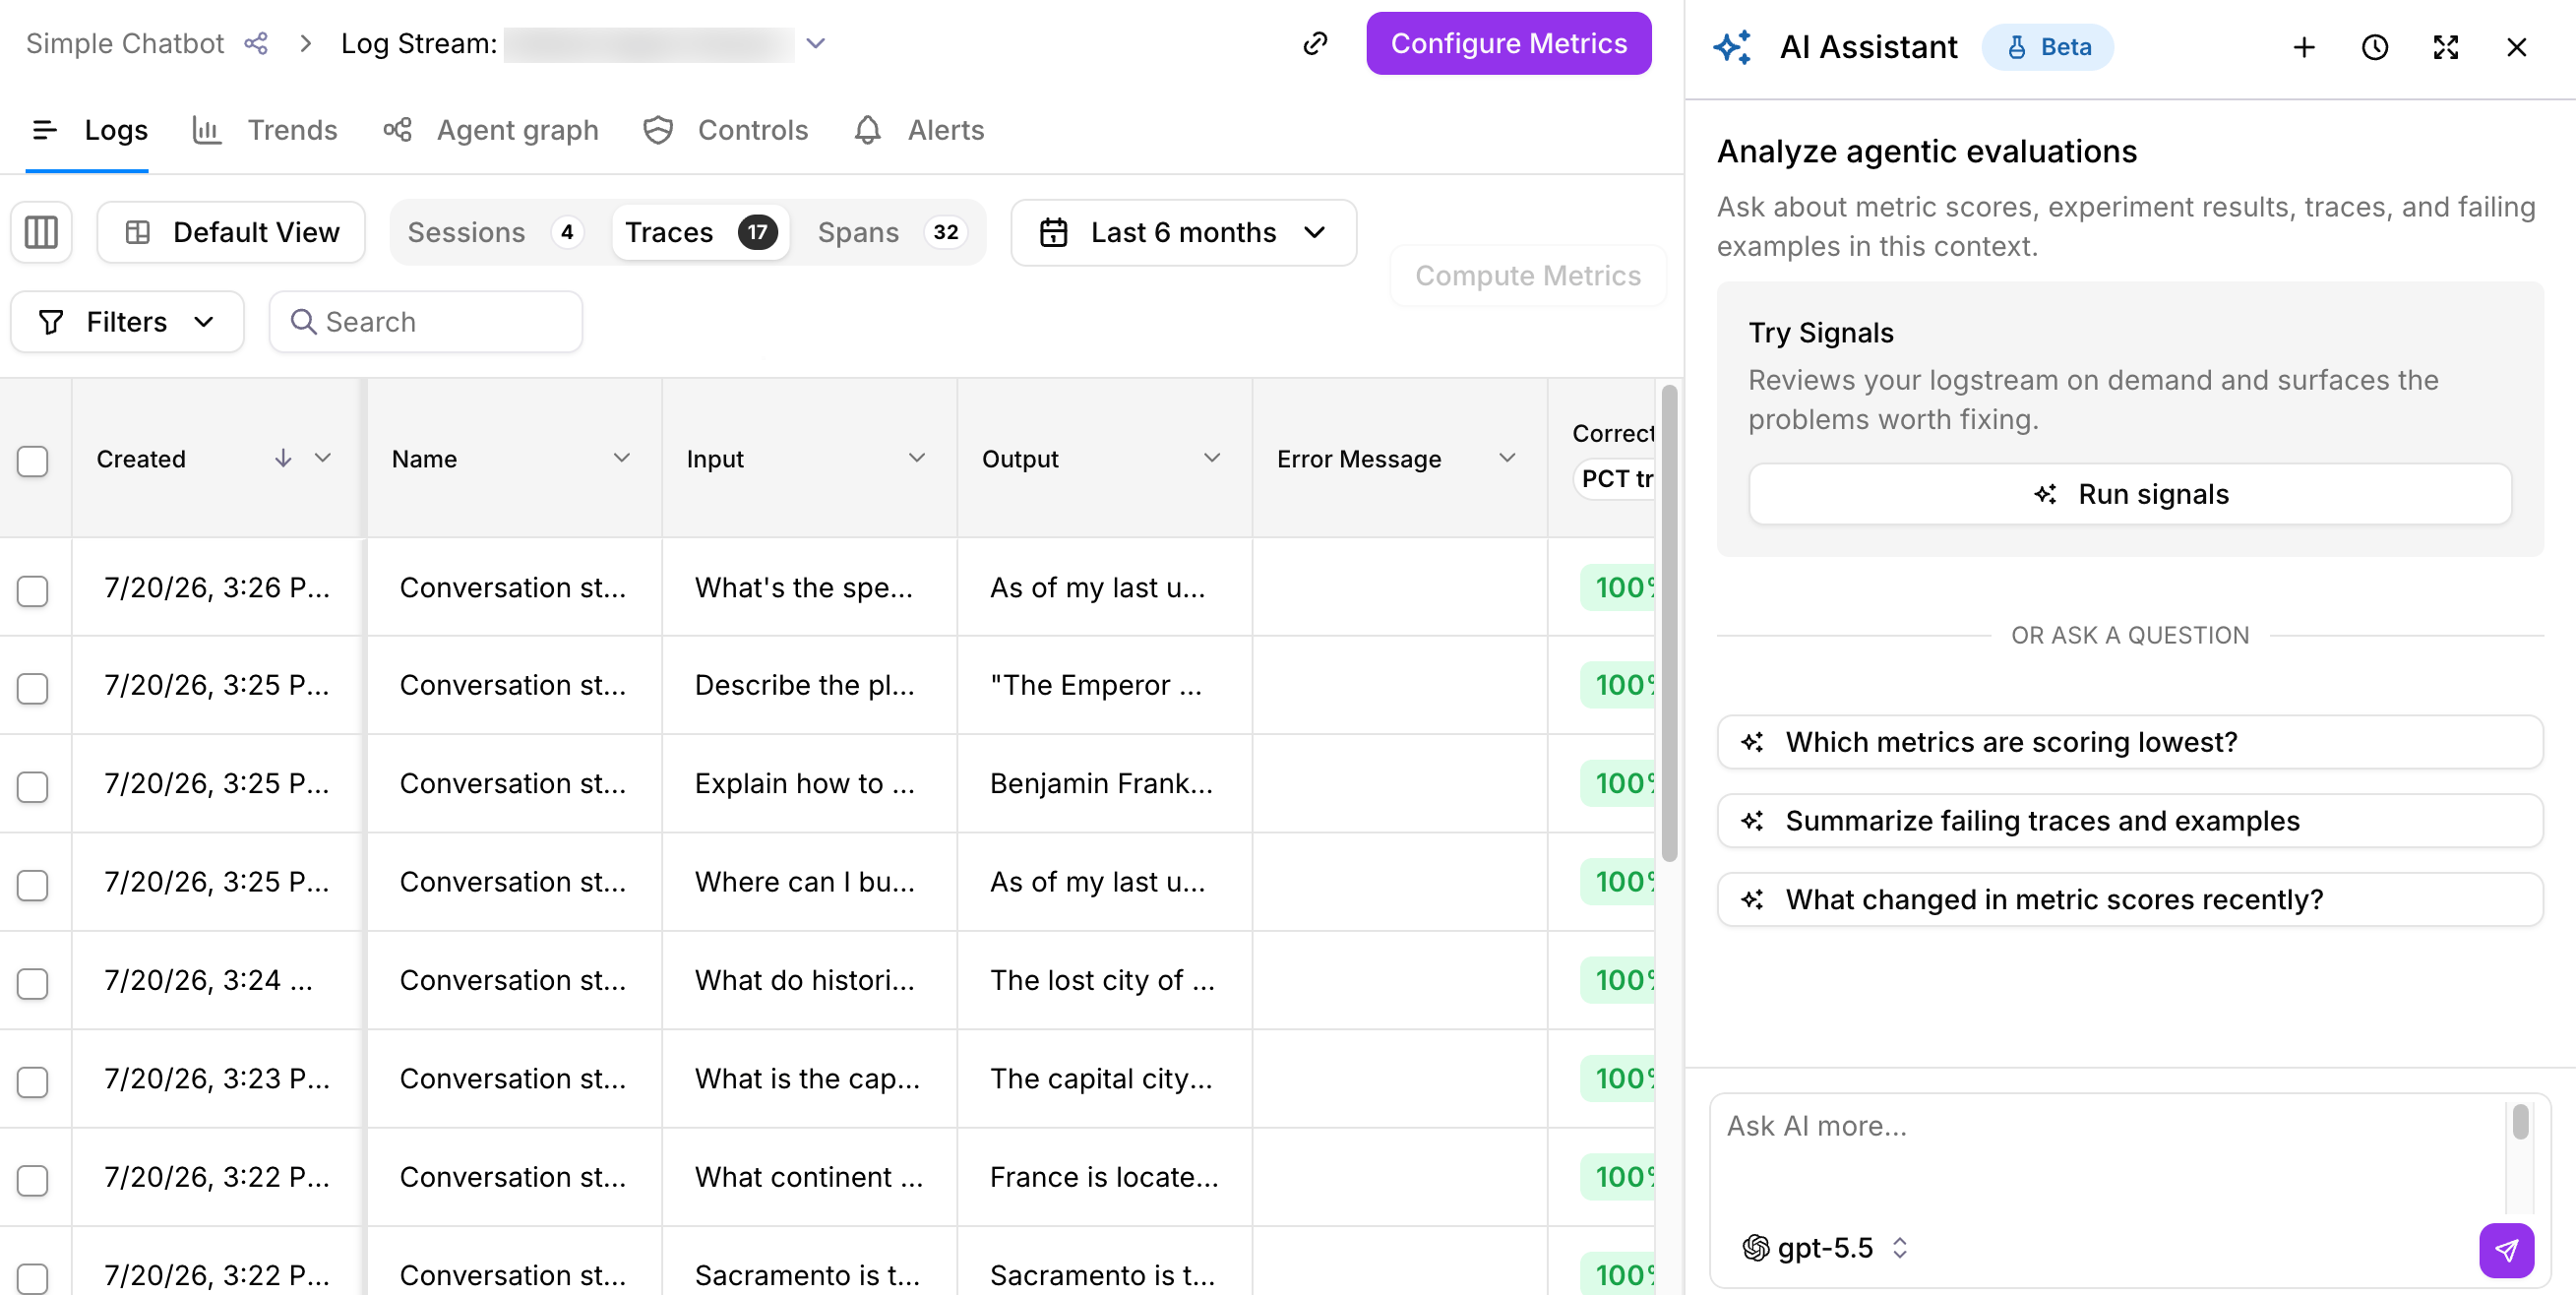
    Select **Run signals**, then review the signals that the assistant surfaces.

    <img src="https://mintcdn.com/v2galileo/aFPChabyDKOZCI5m/images/concepts/signals/signals-ai-assistant.png?fit=max&auto=format&n=aFPChabyDKOZCI5m&q=85&s=e4fb9da9d79ac4f7a825ab3eb902aac8" alt="Run signals from the AI Assistant" width="2618" height="1316" data-path="images/concepts/signals/signals-ai-assistant.png" />
  </Step>

  <Step title="Ask about a signal">
    Ask a question about a signal. The assistant responds with supporting evidence and links to relevant traces and sessions.
  </Step>

  <Step title="Refine the investigation">
    Ask follow-up questions in the same conversation to refine the investigation and recommendations.
  </Step>
</Steps>

Example questions include:

* "Explain this signal and show me the traces behind it."
* "Which signal should I look at first?"
* "How many traces are affected by this signal?"
* "What is the likely root cause of this signal?"
* "What should I change to address this issue?"
* "Are there similar failures in other sessions?"

See [AI Assistant (Beta)](/concepts/ai-assistant) for more information.