> ## Documentation Index
> Fetch the complete documentation index at: https://docs.galileo.ai/llms.txt
> Use this file to discover all available pages before exploring further.
# Instrument LangGraph Agents with OpenTelemetry
> Learn how to add comprehensive observability to your LangGraph agents using OpenTelemetry and Galileo
{/**/}
## Overview
In this cookbook, you'll learn how to instrument a LangGraph agent with OpenTelemetry and OpenInference to capture detailed traces, spans, and metrics. This can be instrumented manually using OpenTelemetry, or through the [Galileo LangGraph callback](/sdk-api/third-party-integrations/langchain/langchain). This approach provides deep visibility into your agent's execution flow, including tool calls, LLM interactions, and decision-making processes.
This tutorial is intended for developers who want to add observability to their LangGraph applications. It assumes you have basic knowledge of:
* Python programming
* The LangGraph framework
* OpenTelemetry concepts
* Galileo platform basics
By the end of this tutorial, you'll be able to:
* Set up OpenTelemetry instrumentation for LangGraph agents
* Configure proper tracing and span creation
* Monitor agent execution in Galileo
* Troubleshoot common instrumentation issues
## Background
**[OpenTelemetry (OTel)](https://opentelemetry.io/docs/what-is-opentelemetry/)** is an open-source observability framework that provides a standardized way to collect, process, and export telemetry data (traces, metrics, and logs). When combined with **[LangGraph](https://docs.langchain.com/langgraph-platform)**, it enables comprehensive monitoring of agent workflows, tool executions, and LLM interactions.
**Why use OpenTelemetry with LangGraph?**
* **Deep Visibility**: Track every step of your agent's execution, from initial input to final output
* **Tool Monitoring**: Monitor tool calls, their parameters, and execution times
* **LLM Observability**: Capture detailed information about model calls, tokens, and costs
* **Error Tracking**: Identify and debug issues in your agent's decision-making process
* **Performance Analysis**: Understand bottlenecks and optimize your agent's performance
## Before you start
Before you start this tutorial, you should:
* Have a Galileo account and API key
* Have Python 3.10+ installed
* Be familiar with LangGraph concepts
* Have a basic understanding of OpenTelemetry
## Prerequisites
### Install required dependencies
For the sake of jumping right into action — we'll be starting from an
[existing Python application](https://github.com/rungalileo/sdk-examples/tree/main/python/agent/langgraph-otel).
* **uv Package Manager**: [Install uv](https://docs.astral.sh/uv/getting-started/installation/)
* **Galileo Account**: [Sign up for free](https://app.galileo.ai)
* **OpenAI API Key**: [Get your API key](https://openai.com/api/)
```bash Terminal theme={null}
git clone https://github.com/rungalileo/sdk-examples
cd sdk-examples/python/agent/langgraph-otel
```
```bash Terminal theme={null}
uv sync
```
This will install all required dependencies including:
* `langgraph` for state graph workflows
* `opentelemetry-*` packages for instrumentation
* `python-dotenv` for environment variable management
Create a free Galileo account at [app.galileo.ai](https://app.galileo.ai) if you haven't already.
* Log into [Galileo dashboard](https://app.galileo.ai/settings/api-keys) and get your API Keys
* Click on your profile/settings
* Generate or copy your API key
* In the Galileo dashboard, create a new project
* Give it a name like "LangGraph-OTel"
* Note the project name - you'll use this in your `.env` file
```bash Terminal theme={null}
cp .env.example .env
```
```ini .env theme={null}
# Your Galileo API key
GALILEO_API_KEY="your-galileo-api-key"
# Your Galileo project name
GALILEO_PROJECT="your-galileo-project-name"
# The name of the Log stream you want to use for logging
GALILEO_LOG_STREAM="your-galileo-log-stream"
# Provide the console url below if you are using a
# custom deployment, and not using the free tier, or app.galileo.ai.
# This will look something like “console.galileo.yourcompany.com”.
# GALILEO_CONSOLE_URL="your-galileo-console-url"
# OpenAI properties
OPENAI_API_KEY="your-openai-api-key"
# Optional. The base URL of your OpenAI deployment.
# Leave this commented out if you are using the default OpenAI API.
# OPENAI_BASE_URL="your-openai-base-url-here"
# Optional. Your OpenAI organization.
# OPENAI_ORGANIZATION="your-openai-organization-here"
```
* **Never commit your `.env` file** - it contains your API keys!
* **Project names are case-sensitive** - use exactly what you created in Galileo
* **Log streams** help organize traces (like folders) - create any name you want
## Understand the example
This example demonstrates:
* **Automatic tracing**: OpenInference automatically traces both your LangGraph
workflow and OpenAI API calls
* **Complex workflow**: A three-node pipeline that validates input, calls OpenAI,
and formats the response
* **Production configuration**: Proper authentication and BatchSpanProcessor
setup for efficient trace export
* **LLM observability**: Complete visibility into OpenAI API calls, tokens,
and response processing
### What are these tools
#### OpenTelemetry (OTel)
[OpenTelemetry](https://opentelemetry.io) is like a **diagnostic system** for your code. It creates "traces" that show:
* What functions/operations ran
* How long each step took
* What data flowed through your system
* Where errors occurred
Think of a trace like a detailed timeline of everything that happened when processing a user request.
#### OpenInference
OpenInference is a **specialized version** of OpenTelemetry that understands AI frameworks like LangChain and LangGraph. It automatically creates meaningful traces for AI operations without you having to write extra code.
## Run the example
### Run it
```bash Terminal theme={null}
uv run python main.py
```
### What you'll see
The program does several things:
Sets up both OpenAI client and Galileo tracing credentials
Instruments both LangGraph workflows and OpenAI API calls
Processes the question "what moons did Galileo discover" through a 3-node pipeline
Sends comprehensive traces to Galileo showing the full LLM interaction
**Console Output:**
```text Terminal Output theme={null}
✓ OpenAI client configured
OTEL Headers: Galileo-API-Key=your-galileo-api-key,project=your-project-name,
logstream=your-logstream-name
✓ LangGraph instrumentation applied - automatic spans will be created
✓ OpenAI instrumentation applied - LLM calls will be traced
📥 Validating input: 'what moons did galileo discover'
⚙️ Calling OpenAI with: 'what moons did galileo discover'
✓ Received response: 'Galileo Galilei discovered four moons of Jupiter,
which are now known as the Galilean moons. They ar...'
✨ Parsed answer: 'Galileo Galilei discovered four moons of Jupiter,
which are now known as the Galilean moons.'
=== FINAL RESULT ===
Question: what moons did galileo discover`
LLM Response: Galileo Galilei discovered four moons of Jupiter, which are
now known as the Galilean moons. They are Io, Europa, Ganymede, and Callisto.
Parsed Answer: Galileo Galilei discovered four moons of Jupiter, which are
now known as the Galilean moons.
✓ Execution complete - check Galileo for traces in your project
```
### Understand the traces
You'll see traces for:
* **`astronomy_qa_session`**: The session-level span grouping all operations
* **`validate_input`**: The first node that validates user input
* **`generate_response`**: The OpenAI API call node with detailed LLM traces
* **`format_answer`**: The response formatting and parsing node
* **OpenAI API spans**: Detailed traces of the GPT-3.5-turbo call
Each trace shows:
* **Timing**: How long each operation took
* **Attributes**: Key-value data (like input text)
* **Events**: Breadcrumb-style log messages
* **Relationships**: Parent-child span connections
## Code structure
### Main components
```text Project Structure theme={null}
langgraph-otel/
├── main.py # Main workflow implementation
├── pyproject.toml # Project dependencies and metadata
├── .env.example # Environment variable template
└── README.md # Documentation
```
### Workflow architecture
The example implements a three-node LangGraph workflow with comprehensive
OpenTelemetry tracing:
```mermaid theme={null}
graph TD
A["User Question:
'what moons did galileo discover'"] --> B[validate_input]
B --> C[generate_response]
C --> D[format_answer]
D --> E["Final Answer:
'Galileo discovered four moons...'"]
B --> F["OpenTelemetry Span:
validate_input"]
C --> G["OpenTelemetry Span:
generate_response"]
C --> H["OpenAI API Span:
GPT-3.5-turbo"]
D --> I["OpenTelemetry Span:
format_answer"]
F --> J["Tracing Details:
• Input validation
• Span attributes"]
G --> K["Tracing Details:
• API call timing
• Request/response"]
H --> L["LLM Tracing Details:
• Token usage
• Model parameters"]
I --> M["Tracing Details:
• Response parsing
• Answer formatting"]
```
Each node is instrumented with OpenTelemetry spans that capture:
* Input parameters as span attributes
* Processing events and milestones
* Execution timing and metadata
### OpenTelemetry integration
The updated main.py file is structured into the following steps:
```python theme={null}
import os
from typing import TypedDict
# Load environment variables first (contains API keys and project settings)
import dotenv
dotenv.load_dotenv()
# ============================================================================
# OPENTELEMETRY & GALILEO IMPORTS
# ============================================================================
# OpenTelemetry (OTel) is an observability framework that helps you collect
# traces, metrics, and logs from your applications. Think of it as a way to
# "instrument" your code so you can see exactly what's happening during execution.
# Core OpenTelemetry imports
from opentelemetry.sdk import trace as trace_sdk # SDK for creating traces
from opentelemetry import trace as trace_api # API for interacting with traces
# Efficiently batches spans before export
from opentelemetry.sdk.trace.export import BatchSpanProcessor
# Sends traces via HTTP
from opentelemetry.exporter.otlp.proto.http.trace_exporter import OTLPSpanExporter
# Prints traces to console (for debugging)
from opentelemetry.sdk.trace.export import ConsoleSpanExporter
# OpenInference is a specialized instrumentation library that understands AI frameworks
# It automatically creates meaningful spans for LangChain/LangGraph operations
from openinference.instrumentation.langchain import LangChainInstrumentor
from openinference.instrumentation.openai import OpenAIInstrumentor
# LangGraph imports - this is what we're actually instrumenting
from langgraph.graph import StateGraph, END
# OpenAI imports for LLM integration
import openai
```
```python path=null start=31 theme={null}
# ============================================================================
# STEP 1: CONFIGURE API AUTHENTICATION
# ============================================================================
# Configure OpenAI API key
openai_api_key = os.environ.get("OPENAI_API_KEY")
if not openai_api_key:
raise ValueError("OPENAI_API_KEY environment variable is required")
# Initialize OpenAI client
client = openai.OpenAI(api_key=openai_api_key)
print("✓ OpenAI client configured")
# Galileo is an AI observability platform that helps you monitor and debug
# AI applications. It receives and visualizes the traces we'll generate.
# Set up authentication headers for Galileo
# These tell Galileo who you are and which project to store traces in
headers = {
"Galileo-API-Key": os.environ.get("GALILEO_API_KEY"), # Your unique API key
"project": os.environ.get("GALILEO_PROJECT"), # Which Galileo project to use
# Organize traces within the project
"logstream": os.environ.get("GALILEO_LOG_STREAM", "default"),
}
# OpenTelemetry requires headers in a specific format: "key1=value1,key2=value2"
# This converts our dictionary to that format
os.environ["OTEL_EXPORTER_OTLP_TRACES_HEADERS"] = ",".join([
f"{k}={v}" for k, v in headers.items()
])
# Debug: Print the formatted headers to verify they're correct
print(f"OTEL Headers: {os.environ['OTEL_EXPORTER_OTLP_TRACES_HEADERS']}")
# ============================================================================
# STEP 2: CONFIGURE OPENTELEMETRY TRACING
# ============================================================================
# OpenTelemetry works by creating "spans" - units of work that represent operations
# in your application. Spans are organized into "traces" that show the full flow
# of a request through your system.
# Define where to send the traces - Galileo's OpenTelemetry endpoint
endpoint = "https://api.galileo.ai/otel/traces"
# Create a TracerProvider with descriptive resource information
# This helps identify these traces as coming from OpenTelemetry in Galileo
from opentelemetry.sdk.resources import Resource
resource = Resource.create({
"service.name": "LangGraph-OpenTelemetry-Demo",
"service.version": "1.0.0",
"deployment.environment": "development"
})
tracer_provider = trace_sdk.TracerProvider(resource=resource)
# Add a span processor that sends traces to Galileo
# BatchSpanProcessor is more efficient than SimpleSpanProcessor for production
# because it batches multiple spans together before sending
# OTLP = OpenTelemetry Protocol
tracer_provider.add_span_processor(
BatchSpanProcessor(OTLPSpanExporter(endpoint))
)
# OPTIONAL: Console output disabled to reduce noise in Galileo
# Uncomment the next 3 lines if you want local console debugging:
# tracer_provider.add_span_processor(
# BatchSpanProcessor(ConsoleSpanExporter())
# )
# Register our tracer provider as the global one
# This means all OpenTelemetry operations will use our configuration
trace_api.set_tracer_provider(tracer_provider=tracer_provider)
# ============================================================================
# STEP 3: APPLY OPENINFERENCE INSTRUMENTATION
# ============================================================================
# OpenInference automatically instruments LangChain/LangGraph to create spans
# for AI operations. This gives us detailed visibility into:
# - LangGraph workflow execution
# - Individual node processing
# - State transitions
# - Input/output data
LangChainInstrumentor().instrument(tracer_provider=tracer_provider)
print("✓ LangGraph instrumentation applied - automatic spans will be created")
# Also instrument OpenAI calls to capture LLM input/output
OpenAIInstrumentor().instrument(tracer_provider=tracer_provider)
print("✓ OpenAI instrumentation applied - LLM calls will be traced")
# Get a tracer for creating custom spans manually
# We'll use this in our node functions below
tracer = trace_api.get_tracer(__name__)
```
```python theme={null}
# ============================================================================
# STEP 4: DEFINE THE LANGGRAPH STATE AND NODES
# ============================================================================
# LangGraph uses a shared state object (a dict) that flows through nodes. Each
# node reads from the state and can write updates back to it.
class AgentState(TypedDict, total=False):
user_input: str # The user's input question
llm_response: str # The raw response from the LLM
parsed_answer: str # The processed/cleaned answer
# Node 1: Input Validation
# Validates and prepares the user input for processing
def validate_input(state: AgentState):
user_input = state.get("user_input", "")
print(f"📥 Validating input: '{user_input}'")
# Add span attributes for better observability
current_span = trace_api.get_current_span()
if current_span:
current_span.set_attribute("input.value", str(state))
current_span.set_attribute("output.value", user_input)
current_span.set_attribute("node.type", "validation")
return {"user_input": user_input}
# Node 2: Generate Response
# Calls OpenAI to generate a response to the user's question
# OpenAI instrumentation will automatically create detailed spans
def generate_response(state: AgentState):
user_input = state["user_input"]
try:
print(f"⚙️ Calling OpenAI with: '{user_input}'")
# Make the OpenAI API call - OpenAI instrumentation handles tracing
response = client.chat.completions.create(
model="gpt-3.5-turbo",
messages=[
{"role": "user", "content": user_input}
],
max_tokens=300,
temperature=0.7
)
# Extract the response content
llm_response = response.choices[0].message.content
print(f"✓ Received response: '{llm_response[:100]}...'")
return {"llm_response": llm_response}
except Exception as e:
print(f"❌ Error calling OpenAI: {e}")
return {"llm_response": f"Error: {str(e)}"}
# Node 3: Format Answer
# Extracts and formats a clean answer from the raw LLM response
def format_answer(state: AgentState):
llm_response = state.get("llm_response", "")
# Simple parsing - extract first sentence for a concise answer
sentences = llm_response.split('. ')
parsed_answer = sentences[0] if sentences else llm_response
# Clean up the answer
parsed_answer = parsed_answer.strip()
if not parsed_answer.endswith('.') and parsed_answer:
parsed_answer += '.'
print(f"✨ Parsed answer: '{parsed_answer}'")
# Add span attributes for better observability
current_span = trace_api.get_current_span()
if current_span:
current_span.set_attribute("input.value", llm_response)
current_span.set_attribute("output.value", parsed_answer)
current_span.set_attribute("node.type", "formatting")
return {"parsed_answer": parsed_answer}
# ============================================================================
# STEP 5: BUILD AND RUN THE LANGGRAPH WORKFLOW
# ============================================================================
workflow = StateGraph(AgentState)
workflow.add_node("validate_input", validate_input)
workflow.add_node("generate_response", generate_response)
workflow.add_node("format_answer", format_answer)
# Entry point and edges define the control flow of the graph
workflow.set_entry_point("validate_input")
workflow.add_edge("validate_input", "generate_response")
workflow.add_edge("generate_response", "format_answer")
workflow.add_edge("format_answer", END)
# Compile builds the runnable app
app = workflow.compile()
```
```python theme={null}
# Run the app and observe traces in both console and Galileo
if __name__ == "__main__":
# Create a session-level span to group all operations
with tracer.start_as_current_span("astronomy_qa_session") as session_span:
inputs = {"user_input": "what moons did galileo discover"}
# Add OpenInference-compatible attributes for proper input/output display
session_span.set_attribute("input.value", inputs["user_input"])
session_span.set_attribute("input.mime_type", "text/plain")
session_span.set_attribute("session.type", "question_answering")
session_span.set_attribute("session.domain", "astronomy")
result = app.invoke(inputs)
# Add result attributes with OpenInference-compatible format
if result.get('llm_response'):
final_answer = result.get('parsed_answer', result.get('llm_response'))
session_span.set_attribute("output.value", final_answer)
session_span.set_attribute("output.mime_type", "text/plain")
session_span.set_status(trace_api.Status(trace_api.StatusCode.OK))
else:
session_span.set_status(trace_api.Status(
trace_api.StatusCode.ERROR, "No response generated"))
print(f"\n=== FINAL RESULT ===")
print(f"Question: {result.get('user_input', 'N/A')}")
print(f"LLM Response: {result.get('llm_response', 'N/A')}")
print(f"Parsed Answer: {result.get('parsed_answer', 'N/A')}")
print("✓ Execution complete - check Galileo for traces in your project")
```
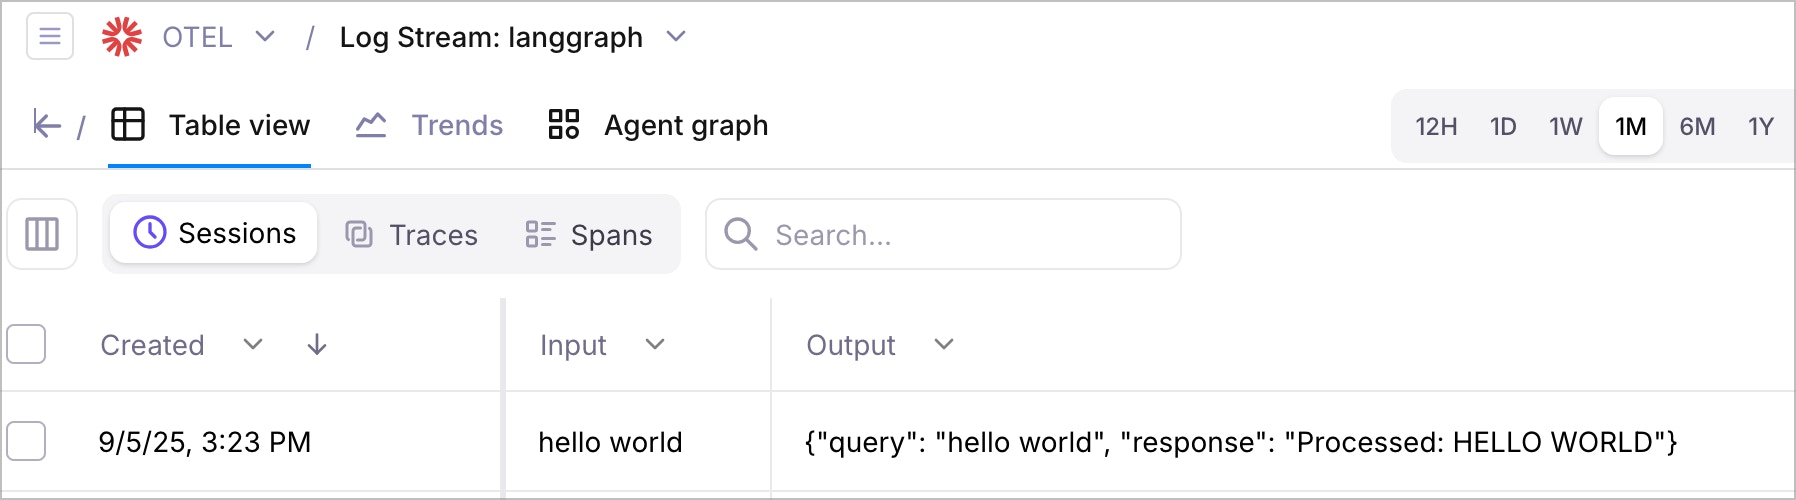
#### Review your traces in Galileo
Go to [app.galileo.ai](https://app.galileo.ai) and log in
Click on the project you created (e.g., "LangGraph Demo") and then the relevant Log stream name.
Look for traces with names like:
* `astronomy_qa_session`
* `validate_input`
* `generate_response`
* `format_answer`
* OpenAI API call traces
Click on any trace to see:
* Detailed attributes and events
* Hierarchical span relationships
 ### Understand the trace structure
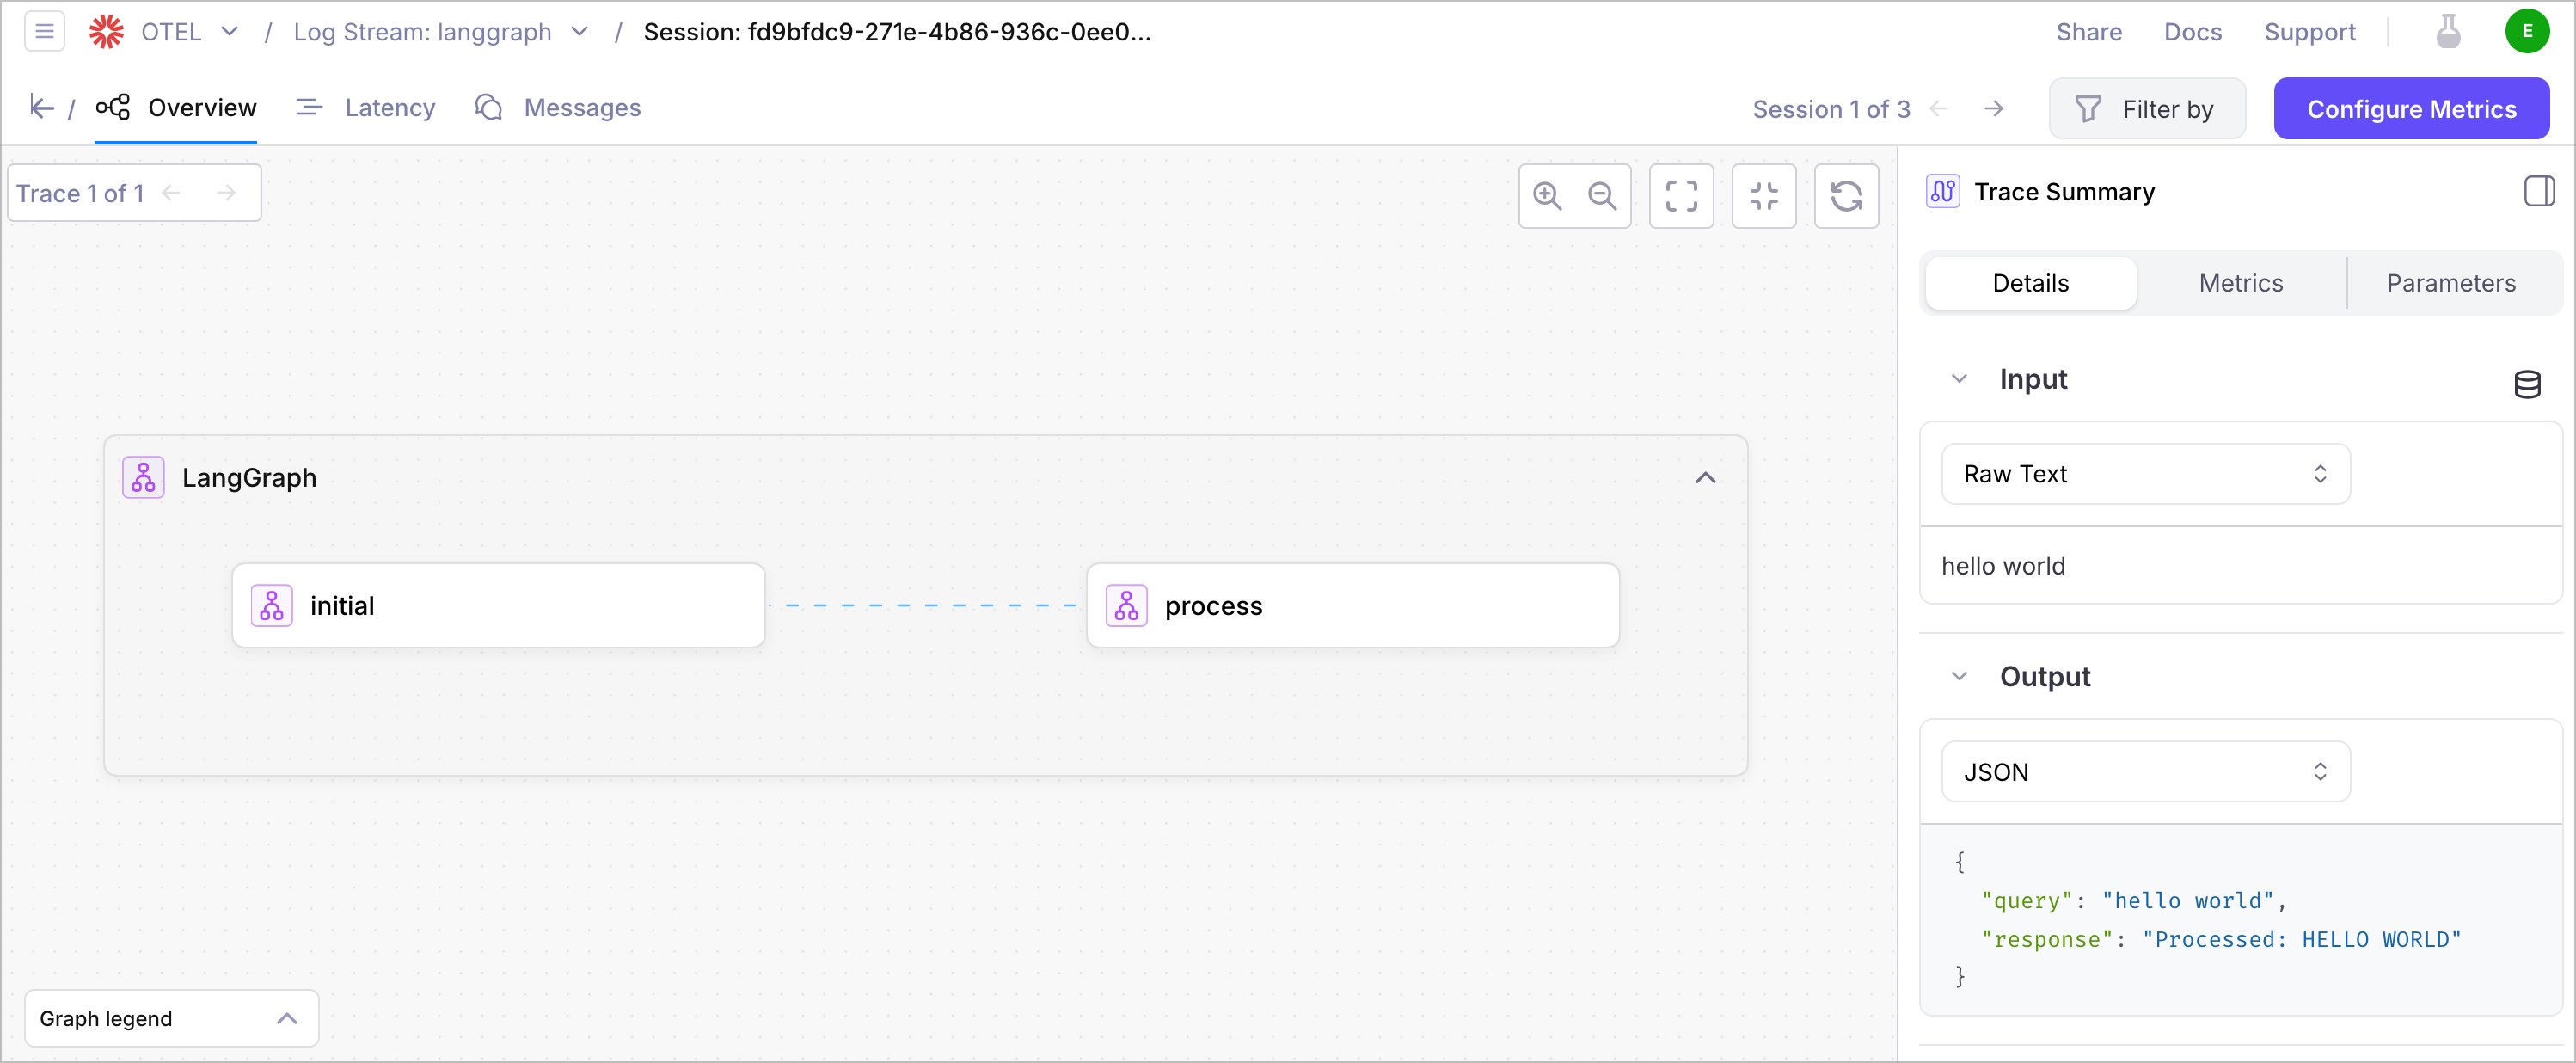
Your traces will show:
* **Root Span**: The main agent execution
* **Node Spans**: Individual workflow nodes with timing and data
* **Custom Spans**: Any custom spans you've created with attributes and events
* **Error Spans**: Any errors that occurred during execution
### Understand the trace structure
Your traces will show:
* **Root Span**: The main agent execution
* **Node Spans**: Individual workflow nodes with timing and data
* **Custom Spans**: Any custom spans you've created with attributes and events
* **Error Spans**: Any errors that occurred during execution
 ### Key metrics to monitor
* **Execution Time**: How long your agent takes to complete
* **Node Performance**: Individual node execution times
* **Error Rate**: Frequency of errors in your agent
* **Data Flow**: How data moves through your workflow
## Troubleshooting
### Common issues and solutions
#### Missing environment variables
```text Error Output theme={null}
Error: GALILEO_API_KEY not found
```
**Solution**: Ensure your `.env` file is properly configured and located in the project root.
#### Network connectivity
```text Error Output theme={null}
Error: Failed to export traces
```
**Solution**:
* Verify internet connectivity
* Check `GALILEO_CONSOLE_URL` if using custom deployment
* Ensure firewall allows OTLP exports
#### Authentication errors
```text Error Output theme={null}
Error: 403 Forbidden
```
**Solution**:
* Verify `GALILEO_API_KEY` is correct and active
* Check project permissions in Galileo dashboard
#### Import errors
```text Error Output theme={null}
ModuleNotFoundError: No module named 'langgraph'
```
**Solution**: Ensure dependencies are installed with `uv sync`
### Debugging tips
The example includes console span output for local debugging
Add print statements to verify `.env` variables are loaded
Test OTLP endpoint connectivity independently
Check both console output and Galileo dashboard for error details
## Summary
In this cookbook, you learned how to:
* Set up OpenTelemetry instrumentation for LangGraph agents using the existing SDK example
* Configure proper tracing with Galileo using environment variables
* Understand the workflow architecture and span structure
* View and analyze traces in the Galileo console
* Troubleshoot common instrumentation issues
* Follow best practices for observability and development
## Next steps
Consider exploring these related topics to enhance your observability:
Learn more about OpenTelemetry integration with Galileo
Run experiments with your instrumented LangGraph agents
Scale your observability to multi-agent systems
Add custom metrics to track agent performance
### Key metrics to monitor
* **Execution Time**: How long your agent takes to complete
* **Node Performance**: Individual node execution times
* **Error Rate**: Frequency of errors in your agent
* **Data Flow**: How data moves through your workflow
## Troubleshooting
### Common issues and solutions
#### Missing environment variables
```text Error Output theme={null}
Error: GALILEO_API_KEY not found
```
**Solution**: Ensure your `.env` file is properly configured and located in the project root.
#### Network connectivity
```text Error Output theme={null}
Error: Failed to export traces
```
**Solution**:
* Verify internet connectivity
* Check `GALILEO_CONSOLE_URL` if using custom deployment
* Ensure firewall allows OTLP exports
#### Authentication errors
```text Error Output theme={null}
Error: 403 Forbidden
```
**Solution**:
* Verify `GALILEO_API_KEY` is correct and active
* Check project permissions in Galileo dashboard
#### Import errors
```text Error Output theme={null}
ModuleNotFoundError: No module named 'langgraph'
```
**Solution**: Ensure dependencies are installed with `uv sync`
### Debugging tips
The example includes console span output for local debugging
Add print statements to verify `.env` variables are loaded
Test OTLP endpoint connectivity independently
Check both console output and Galileo dashboard for error details
## Summary
In this cookbook, you learned how to:
* Set up OpenTelemetry instrumentation for LangGraph agents using the existing SDK example
* Configure proper tracing with Galileo using environment variables
* Understand the workflow architecture and span structure
* View and analyze traces in the Galileo console
* Troubleshoot common instrumentation issues
* Follow best practices for observability and development
## Next steps
Consider exploring these related topics to enhance your observability:
Learn more about OpenTelemetry integration with Galileo
Run experiments with your instrumented LangGraph agents
Scale your observability to multi-agent systems
Add custom metrics to track agent performance