> ## Documentation Index
> Fetch the complete documentation index at: https://docs.galileo.ai/llms.txt
> Use this file to discover all available pages before exploring further.
# Log with OpenTelemetry, LangGraph, and OpenAI
> Learn how to integrate Galileo with OpenTelemetry and OpenInference for comprehensive observability and tracing.
## Overview
This guide walks you through running a LangGraph app with:
* OpenTelemetry tracing
* OpenInference semantic conventions
* Galileo’s built-in span processor
* Automatic LangGraph + OpenAI instrumentation
This example application demonstrates how to build a traced,
observable LangGraph workflow that processes a user’s question,
generates an LLM response, formats it,
and sends complete telemetry to Galileo using OpenTelemetry
At a high level, the app:
* Takes a user question
* Validates the input
* Sends the question to OpenAI
* Parses/cleans the LLM response
* Returns a final formatted answer
* Emits detailed traces for every step
The full code example is available in the [LangGraph Open Telemetry SDK example](https://github.com/rungalileo/sdk-examples/tree/main/python/agent/langgraph-open-telemetry).
### In this guide you will
* [Set up your environment and requirements](#set-up-your-environment-and-requirements)
* [Understanding and running the LangGraph Open Telemetry SDK example](#understanding-and-running-the-langgraph-open-telemetry-sdk-example)
* [Run your application with OpenTelemetry](#run-your-application-with-opentelemetry)
## Before you start
Below, you'll find instructions on the key parts that come into play when using OpenTelemetry for observability.
* Python 3.10+ installed
* A free [Galileo account](https://app.galileo.ai/sign-up) and [API key](https://app.galileo.ai/settings/api-keys)
* An [OpenAI API key](https://platform.openai.com/api-keys)
* Basic understanding of LangGraph concepts
* Familiarity with OpenTelemetry basics
## Set up your environment and requirements
For this how-to guide we’ll assume that you have some familiarity with LangGraph,
as well as some familiarity with basic observability principles. To follow this guide pull the code
from the [LangGraph Open Telemetry SDK example](https://github.com/rungalileo/sdk-examples/tree/main/python/agent/langgraph-open-telemetry)
and work in the root of that directory.
The [corresponding repository](https://github.com/rungalileo/sdk-examples/tree/main/python/agent/langgraph-open-telemetry)
ships with a [pyproject.toml](https://github.com/rungalileo/sdk-examples/blob/main/python/agent/langgraph-open-telemetry/pyproject.toml)
and so uv is recommended for this project.
After installing [uv](https://docs.astral.sh/uv/),
you can create and sync a virtual environment with:
```bash theme={null}
uv sync
```
Create environment file or copy it from the
[.env.example](https://github.com/rungalileo/sdk-examples/blob/main/python/agent/langgraph-open-telemetry/.env.example) file
```bash theme={null}
cp .env.example .env
```
Skip this step if you are using Galileo Cloud.
The OTel endpoint is different from Galileo's regular API endpoint and is specifically designed to receive telemetry data in the OTLP format.
If you are using:
* **Galileo Cloud** at [app.galileo.ai](https://app.galileo.ai), then you don't need to provide a custom OTel endpoint.
The default endpoint `https://api.galileo.ai/otel/traces` will be used automatically.
* A **self-hosted Galileo deployment**, replace the `https://api.galileo.ai/otel/traces` endpoint with your deployment URL. The format of this URL is based on your console URL, replacing `console` with `api` and appending `/otel/traces`.
For example:
* if your console URL is `https://console.galileo.example.com`, the OTel endpoint would be `https://api.galileo.example.com/otel/traces`
* if your console URL is `https://console-galileo.apps.mycompany.com`, the OTel endpoint would be `https://api-galileo.apps.mycompany.com/otel/traces`
The convention is to store this in the `OTEL_EXPORTER_OTLP_ENDPOINT` environment variable. For example:
```python Python theme={null}
os.environ["OTEL_EXPORTER_OTLP_TRACES_ENDPOINT"] = \
"https://api.galileo.ai/otel/traces"
```
## Understanding and running the LangGraph Open Telemetry SDK example
After setting up your environment variables, initialize
OpenTelemetry and create the `GalileoSpanProcessor`. The
`TracerProvider` manages tracers and spans,
while the `GalileoSpanProcessor` is responsible for
exporting those spans to Galileo.
```python theme={null}
from galileo import otel
from opentelemetry import trace as trace_api
from opentelemetry.sdk import trace as trace_sdk
from opentelemetry.sdk.resources import Resource
# GalileoSpanProcessor (no manual OTLP config required) loads the env vars for
# the Galileo API key, Project, and Log stream. Make sure to set them first.
galileo_span_processor = otel.GalileoSpanProcessor(
# Optional parameters if not set, uses env var
# project=os.environ["GALILEO_PROJECT"],
# logstream=os.environ.get("GALILEO_LOG_STREAM"),
)
# Resource metadata that will appear in Galileo
resource = Resource.create({
"service.name": "LangGraph-OpenTelemetry-Demo",
"service.version": "1.0.0",
"deployment.environment": "development",
})
# Create tracer provider
tracer_provider = trace_sdk.TracerProvider(resource=resource)
# Attach Galileo processor
otel.add_galileo_span_processor(tracer_provider, galileo_span_processor)
# Register this provider globally
trace_api.set_tracer_provider(tracer_provider)
```
Enable automatic AI observability by applying OpenInference instrumentors. These automatically capture LLM calls,
token usage, and model performance without requiring changes to your existing code.
```python theme={null}
from openinference.instrumentation.langchain import LangChainInstrumentor
from openinference.instrumentation.openai import OpenAIInstrumentor
LangChainInstrumentor().instrument(tracer_provider=tracer_provider)
OpenAIInstrumentor().instrument(tracer_provider=tracer_provider)
```
**What this enables automatically:**
* LangGraph operations and OpenAI API calls are traced
* Token usage and model information is captured
* Performance metrics and errors are recorded
This example app will build a simple LangGraph workflow that:
* Validates user input with `validate_input`
* Calls OpenAI with `generate_response`
* Formats the final answer with `format_answer`
```python theme={null}
from typing import TypedDict
from langgraph.graph import StateGraph
from openai import OpenAI
class AgentState(TypedDict, total=False):
user_input: str # The user's input question
llm_response: str # The raw response from the LLM
parsed_answer: str # The processed/cleaned answer
# Node 1: Input Validation
# Validates and prepares the user input for processing
def validate_input(state: AgentState):
user_input = state.get("user_input", "")
print(f"📥 Validating input: '{user_input}'")
return {"user_input": user_input}
# Node 2: Generate Response
# Calls OpenAI to generate a response to the user's question
# OpenAI instrumentation will automatically create detailed spans
def generate_response(state: AgentState):
user_input = state.get("user_input", "")
try:
print(f"⚙️ Calling OpenAI with: '{user_input}'")
# Make the OpenAI API call - OpenAI instrumentation handles tracing
response = client.chat.completions.create(
model="gpt-3.5-turbo",
messages=[{"role": "user", "content": user_input}],
max_tokens=300,
temperature=0.7,
)
# Extract the response content
llm_response = response.choices[0].message.content
if not llm_response:
print("❌ No response from OpenAI")
else:
print(f"✓ Received response: '{llm_response[:100]}...'")
return {"llm_response": llm_response}
except Exception as e:
print(f"❌ Error calling OpenAI: {e}")
return {"llm_response": f"Error: {str(e)}"}
# Node 3: Format Answer
# Extracts and formats a clean answer from the raw LLM response
def format_answer(state: AgentState):
llm_response = state.get("llm_response", "")
# Simple parsing - extract first sentence for a concise answer
sentences = llm_response.split(". ")
parsed_answer = sentences[0] if sentences else llm_response
# Clean up the answer
parsed_answer = parsed_answer.strip()
if not parsed_answer.endswith(".") and parsed_answer:
parsed_answer += "."
print(f"✨ Parsed answer: '{parsed_answer}'")
return {"parsed_answer": parsed_answer}
```
Everything is assembled using LangGraph’s `StateGraph`:
```python theme={null}
from langgraph import StateGraph, END
workflow = StateGraph(AgentState)
workflow.add_node("validate_input", validate_input)
workflow.add_node("generate_response", generate_response)
workflow.add_node("format_answer", format_answer)
workflow.set_entry_point("validate_input")
workflow.add_edge("validate_input", "generate_response")
workflow.add_edge("generate_response", "format_answer")
workflow.add_edge("format_answer", END)
app = workflow.compile()
```
Finally, run the LangGraph application to observe the traces in Galileo.
```python theme={null}
# Run the app and observe traces in both console and Galileo
if __name__ == "__main__":
inputs = {"user_input": "what moons did galileo discover"}
result = app.invoke(AgentState(**inputs))
provider = trace_api.get_tracer_provider()
print("\n=== FINAL RESULT ===")
print(f"Question: {result.get('user_input', 'N/A')}")
print(f"LLM Response: {result.get('llm_response', 'N/A')}")
print(f"Parsed Answer: {result.get('parsed_answer', 'N/A')}")
print("✓ Execution complete - check Galileo for traces in your project/log stream")
```
Finnaly, run [LangGraph Open Telemetry SDK example](https://github.com/rungalileo/sdk-examples/tree/main/python/agent/langgraph-open-telemetry)
with:
```bash theme={null}
uv run python main.py
```
Once your application is running with OpenTelemetry configured, you can view your traces in the Galileo dashboard. Navigate to your project and Log stream to see the complete trace graph showing your LangGraph workflow execution.
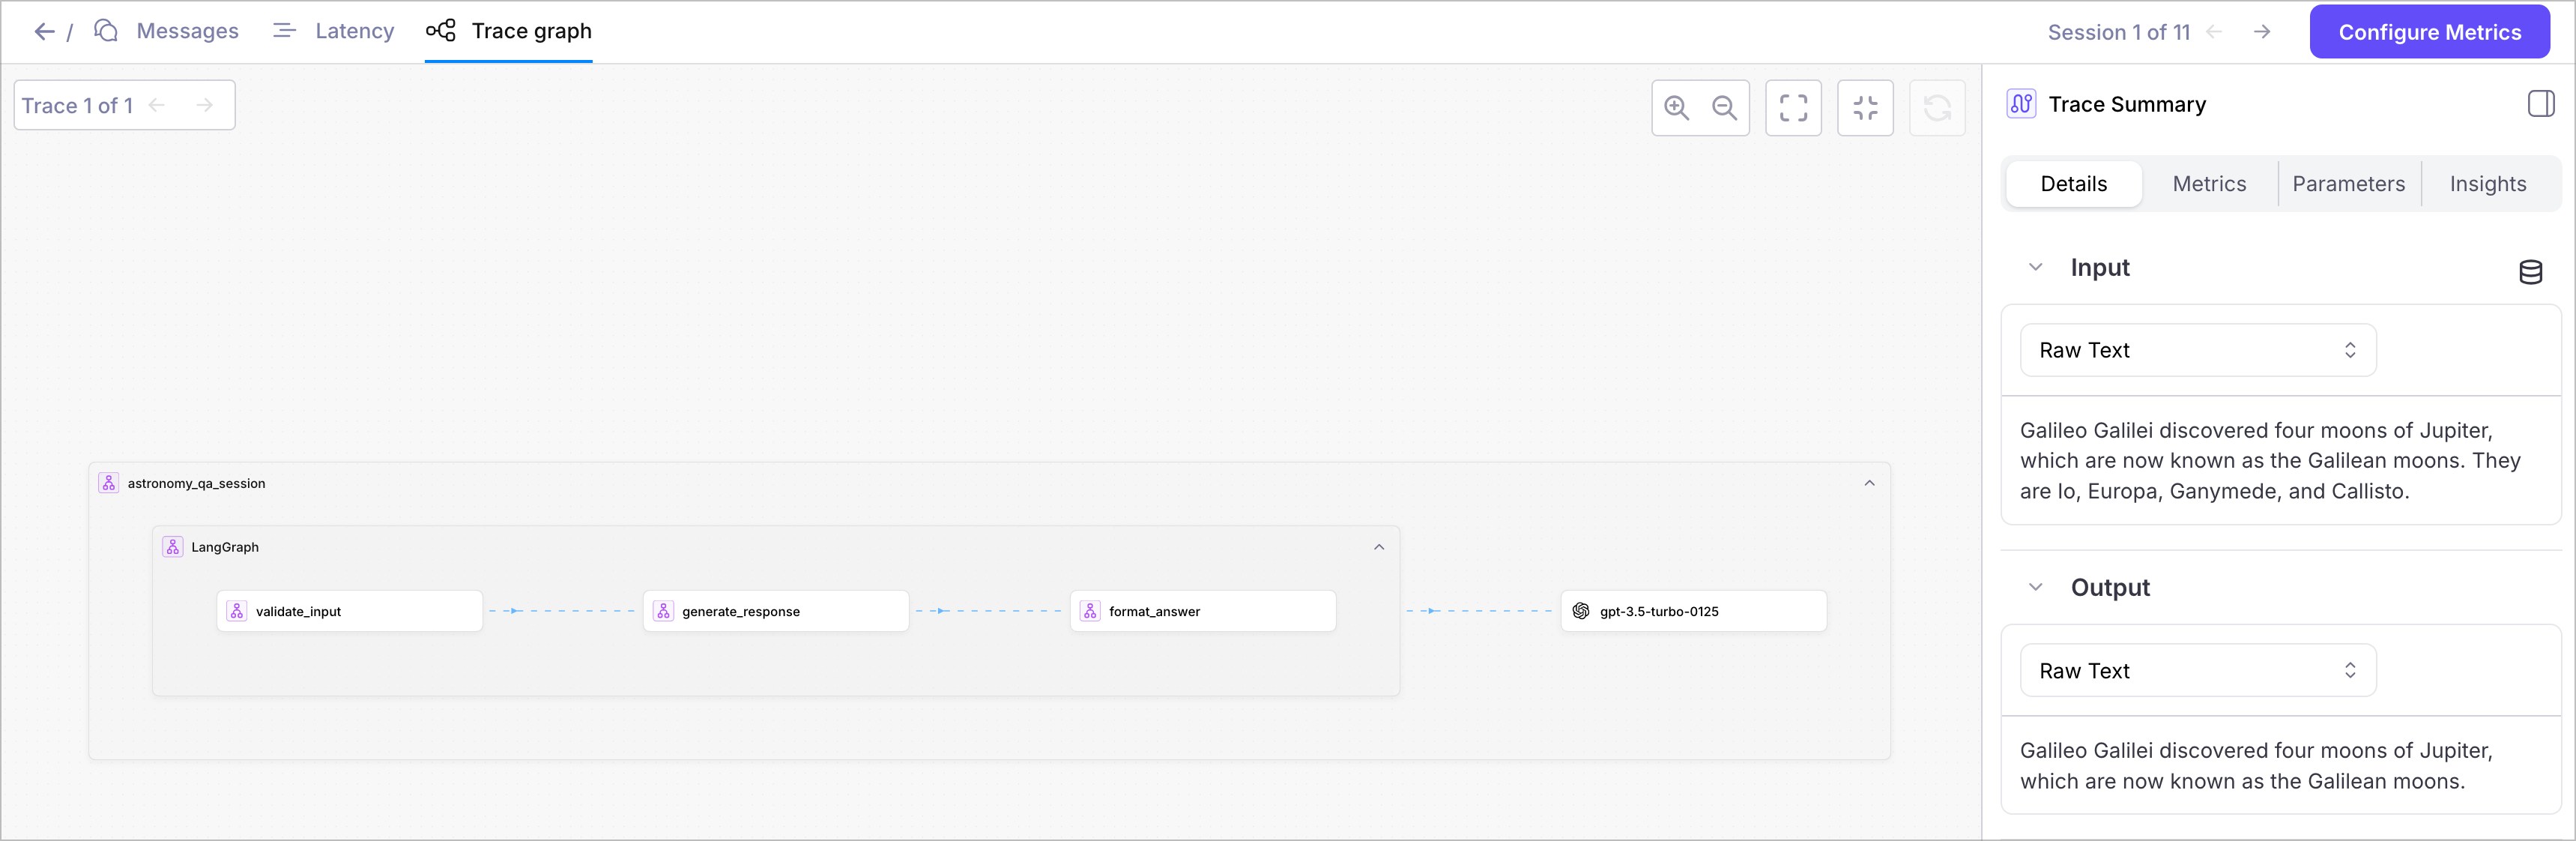 The trace graph displays:
* **Workflow spans** showing the execution flow through your LangGraph nodes
* **LLM call details** with token usage and model information
* **Performance metrics** including timing and resource utilization
* **Error tracking** if any issues occur during execution
## Run your application with OpenTelemetry
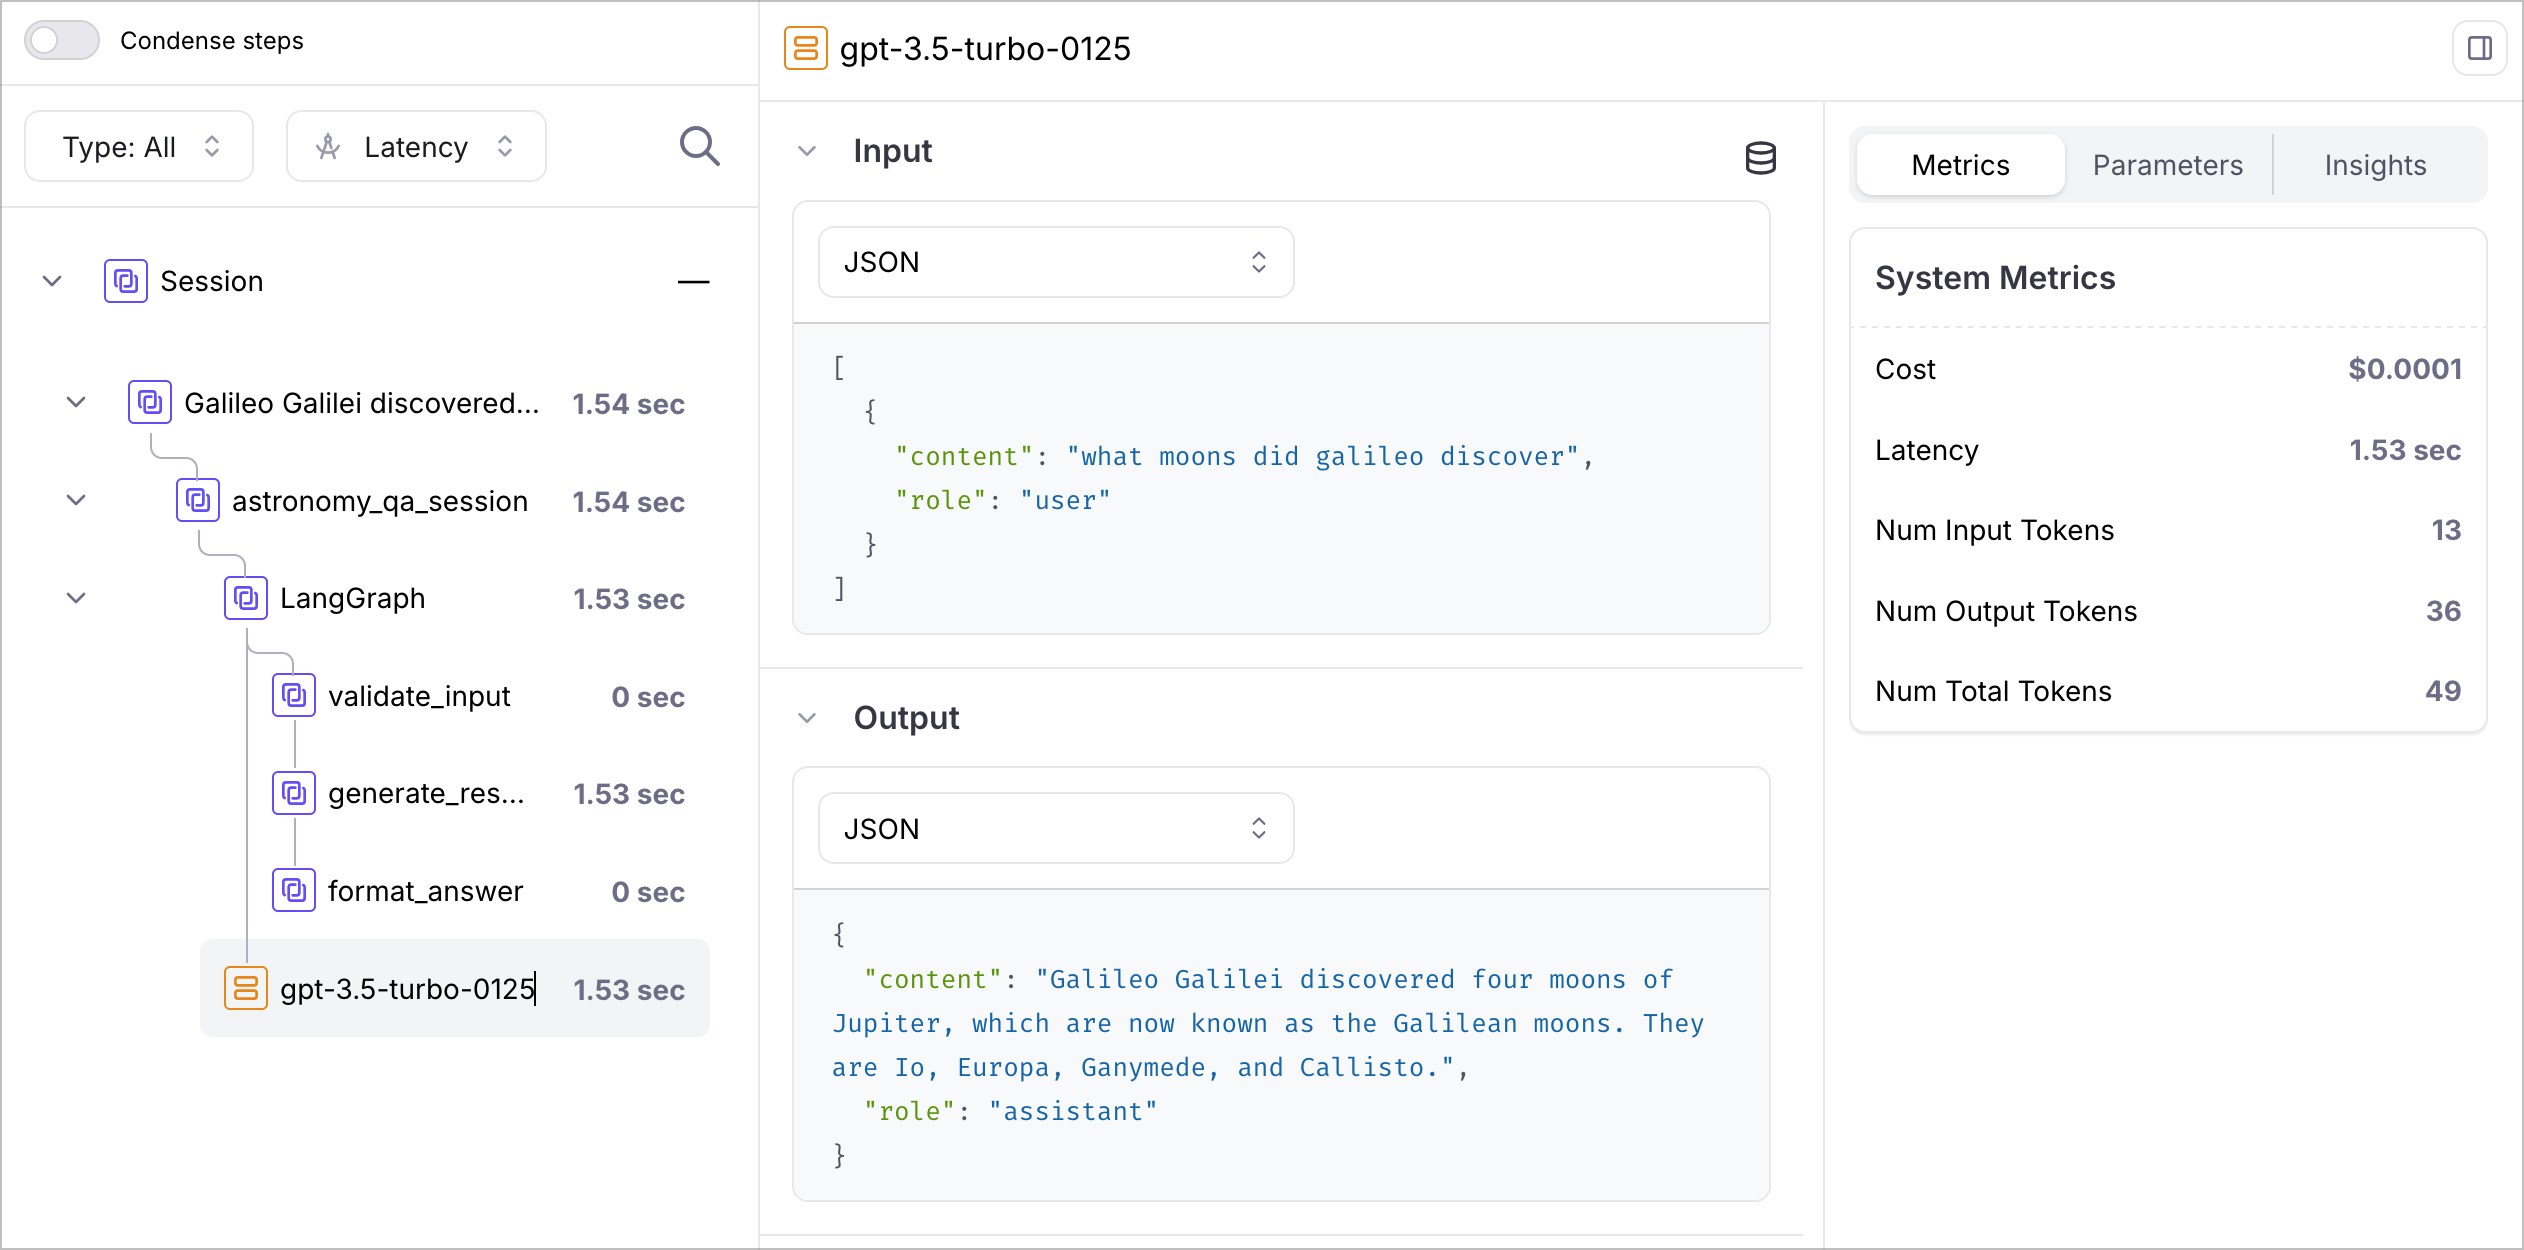
With OpenTelemetry correctly configured, your application will now automatically capture and send observability data to Galileo with every run. You'll see complete traces of your LangGraph workflows, detailed LLM call breakdowns with token counts, and performance insights organized by project and Log stream in your Galileo dashboard.
This provides consistent, well-structured logging across all your AI applications without requiring additional code changes, enabling effective monitoring, debugging, and optimization at scale.
The trace graph displays:
* **Workflow spans** showing the execution flow through your LangGraph nodes
* **LLM call details** with token usage and model information
* **Performance metrics** including timing and resource utilization
* **Error tracking** if any issues occur during execution
## Run your application with OpenTelemetry
With OpenTelemetry correctly configured, your application will now automatically capture and send observability data to Galileo with every run. You'll see complete traces of your LangGraph workflows, detailed LLM call breakdowns with token counts, and performance insights organized by project and Log stream in your Galileo dashboard.
This provides consistent, well-structured logging across all your AI applications without requiring additional code changes, enabling effective monitoring, debugging, and optimization at scale.
 ## OpenInference semantic conventions for LangGraph--Advanced Usage
When running your LangGraph app with OpenInference, Galileo automatically applies semantic conventions to your traces, capturing model information, token usage, and performance metrics without any additional code.
For advanced use cases, you can also manually add custom attributes to enhance your traces with domain-specific information:
**Redacted data attributes:** You can attach `galileo.input.redacted` and `galileo.output.redacted` to any span in the trace (root or child) to send redacted versions of input and output alongside the originals. Galileo stores both and can restrict the original data to privileged users. Each attribute is independent — you can set one without the other for partial redaction.
```python theme={null}
# Model information
span.set_attribute("gen_ai.system", "openai")
span.set_attribute("gen_ai.request.model", "gpt-4")
span.set_attribute("gen_ai.request.prompt", user_prompt)
# Response information
span.set_attribute("gen_ai.response.model", "gpt-4")
span.set_attribute("gen_ai.response.content", ai_response)
# Token usage
span.set_attribute("gen_ai.usage.prompt_tokens", 150)
span.set_attribute("gen_ai.usage.completion_tokens", 75)
span.set_attribute("gen_ai.usage.total_tokens", 225)
# Redacted data (privacy/compliance)
# Replace sensitive content with your own redaction logic
redacted_user_input = mask_pii(user_prompt) # e.g. "My SSN is ***-**-****"
redacted_ai_response = mask_pii(ai_response) # e.g. "Your account *** is active"
span.set_attribute("galileo.input.redacted", redacted_user_input)
span.set_attribute("galileo.output.redacted", redacted_ai_response)
```
```python theme={null}
# Add events to spans for additional context
span.add_event("model.loaded", {
"model.name": "gpt-4",
"model.size": "1.7T",
"load.time_ms": 2500
})
span.add_event("inference.started", {
"batch.size": 1,
"max.tokens": 1000
})
span.add_event("inference.completed", {
"duration.ms": 1250,
"tokens.generated": 75
})
```
## Troubleshooting your LangGraph app
Here are some common troubleshooting steps when using OpenTelemetry and OpenInference.
### Headers not formatted correctly
Not seeing your OTel traces in Galileo? Double checker your header formatting. OpenTelemetry requires headers in a specific comma-separated string format, not as a dictionary.
```python theme={null}
# ❌ Wrong - dictionary format won't work with OTel
headers = {"Galileo-API-Key": "your-key", "project": "your-project"}
# ✅ Correct - must be comma-separated string format
os.environ["OTEL_EXPORTER_OTLP_TRACES_HEADERS"] = \
"Galileo-API-Key=your-key,project=your-project,logstream=default"
```
### Wrong endpoint
```python theme={null}
# ❌ Wrong - this is the native SDK endpoint
endpoint = "https://api.galileo.ai/v2/otlp"
# ✅ Correct - this is the OTel endpoint
endpoint = "https://api.galileo.ai/otel/traces"
```
### Console URL incorrect
For custom Galileo deployments, replace `app.galileo.ai` with your deployment URL.
```python theme={null}
# ❌ Wrong - using default URL for custom deployment
endpoint = "https://api.galileo.ai/otel/traces"
# ✅ Correct - using your custom deployment URL
endpoint = "https://api-your-custom-domain.com/galileo/otel/traces"
```
### Missing LangGraph instrumentation
Not seeing your LangGraph workflow traces? Ensure you're instrumenting both LangGraph and the underlying LLM providers. LangGraph workflows require instrumentation at multiple levels to capture the complete execution flow.
```python theme={null}
# ❌ Wrong - only instrumenting OpenAI, missing LangGraph workflow tracing
OpenAIInstrumentor().instrument(tracer_provider=tracer_provider)
# ✅ Correct - instrument both LangGraph workflows and LLM providers
from openinference.instrumentation.langgraph import LangGraphInstrumentor
from openinference.instrumentation.openai import OpenAIInstrumentor
LangGraphInstrumentor().instrument(tracer_provider=tracer_provider)
OpenAIInstrumentor().instrument(tracer_provider=tracer_provider)
```
## Next steps
Complete tutorial with working LangGraph example
Integrate with LangChain using Galileo callbacks
Add custom metrics to track your LangGraph app performance
Run experiments on your instrumented LangGraph workflows
## OpenInference semantic conventions for LangGraph--Advanced Usage
When running your LangGraph app with OpenInference, Galileo automatically applies semantic conventions to your traces, capturing model information, token usage, and performance metrics without any additional code.
For advanced use cases, you can also manually add custom attributes to enhance your traces with domain-specific information:
**Redacted data attributes:** You can attach `galileo.input.redacted` and `galileo.output.redacted` to any span in the trace (root or child) to send redacted versions of input and output alongside the originals. Galileo stores both and can restrict the original data to privileged users. Each attribute is independent — you can set one without the other for partial redaction.
```python theme={null}
# Model information
span.set_attribute("gen_ai.system", "openai")
span.set_attribute("gen_ai.request.model", "gpt-4")
span.set_attribute("gen_ai.request.prompt", user_prompt)
# Response information
span.set_attribute("gen_ai.response.model", "gpt-4")
span.set_attribute("gen_ai.response.content", ai_response)
# Token usage
span.set_attribute("gen_ai.usage.prompt_tokens", 150)
span.set_attribute("gen_ai.usage.completion_tokens", 75)
span.set_attribute("gen_ai.usage.total_tokens", 225)
# Redacted data (privacy/compliance)
# Replace sensitive content with your own redaction logic
redacted_user_input = mask_pii(user_prompt) # e.g. "My SSN is ***-**-****"
redacted_ai_response = mask_pii(ai_response) # e.g. "Your account *** is active"
span.set_attribute("galileo.input.redacted", redacted_user_input)
span.set_attribute("galileo.output.redacted", redacted_ai_response)
```
```python theme={null}
# Add events to spans for additional context
span.add_event("model.loaded", {
"model.name": "gpt-4",
"model.size": "1.7T",
"load.time_ms": 2500
})
span.add_event("inference.started", {
"batch.size": 1,
"max.tokens": 1000
})
span.add_event("inference.completed", {
"duration.ms": 1250,
"tokens.generated": 75
})
```
## Troubleshooting your LangGraph app
Here are some common troubleshooting steps when using OpenTelemetry and OpenInference.
### Headers not formatted correctly
Not seeing your OTel traces in Galileo? Double checker your header formatting. OpenTelemetry requires headers in a specific comma-separated string format, not as a dictionary.
```python theme={null}
# ❌ Wrong - dictionary format won't work with OTel
headers = {"Galileo-API-Key": "your-key", "project": "your-project"}
# ✅ Correct - must be comma-separated string format
os.environ["OTEL_EXPORTER_OTLP_TRACES_HEADERS"] = \
"Galileo-API-Key=your-key,project=your-project,logstream=default"
```
### Wrong endpoint
```python theme={null}
# ❌ Wrong - this is the native SDK endpoint
endpoint = "https://api.galileo.ai/v2/otlp"
# ✅ Correct - this is the OTel endpoint
endpoint = "https://api.galileo.ai/otel/traces"
```
### Console URL incorrect
For custom Galileo deployments, replace `app.galileo.ai` with your deployment URL.
```python theme={null}
# ❌ Wrong - using default URL for custom deployment
endpoint = "https://api.galileo.ai/otel/traces"
# ✅ Correct - using your custom deployment URL
endpoint = "https://api-your-custom-domain.com/galileo/otel/traces"
```
### Missing LangGraph instrumentation
Not seeing your LangGraph workflow traces? Ensure you're instrumenting both LangGraph and the underlying LLM providers. LangGraph workflows require instrumentation at multiple levels to capture the complete execution flow.
```python theme={null}
# ❌ Wrong - only instrumenting OpenAI, missing LangGraph workflow tracing
OpenAIInstrumentor().instrument(tracer_provider=tracer_provider)
# ✅ Correct - instrument both LangGraph workflows and LLM providers
from openinference.instrumentation.langgraph import LangGraphInstrumentor
from openinference.instrumentation.openai import OpenAIInstrumentor
LangGraphInstrumentor().instrument(tracer_provider=tracer_provider)
OpenAIInstrumentor().instrument(tracer_provider=tracer_provider)
```
## Next steps
Complete tutorial with working LangGraph example
Integrate with LangChain using Galileo callbacks
Add custom metrics to track your LangGraph app performance
Run experiments on your instrumented LangGraph workflows