

Overview
In this cookbook, you’ll learn how to instrument a LangGraph agent with OpenTelemetry and OpenInference to capture detailed traces, spans, and metrics. This can be instrumented manually using OpenTelemetry, or through the Galileo LangGraph callback. This approach provides deep visibility into your agent’s execution flow, including tool calls, LLM interactions, and decision-making processes. This tutorial is intended for developers who want to add observability to their LangGraph applications. It assumes you have basic knowledge of:- Python programming
- The LangGraph framework
- OpenTelemetry concepts
- Galileo platform basics
- Set up OpenTelemetry instrumentation for LangGraph agents
- Configure proper tracing and span creation
- Monitor agent execution in Galileo
- Troubleshoot common instrumentation issues
Background
OpenTelemetry (OTel) is an open-source observability framework that provides a standardized way to collect, process, and export telemetry data (traces, metrics, and logs). When combined with LangGraph, it enables comprehensive monitoring of agent workflows, tool executions, and LLM interactions. Why use OpenTelemetry with LangGraph?- Deep Visibility: Track every step of your agent’s execution, from initial input to final output
- Tool Monitoring: Monitor tool calls, their parameters, and execution times
- LLM Observability: Capture detailed information about model calls, tokens, and costs
- Error Tracking: Identify and debug issues in your agent’s decision-making process
- Performance Analysis: Understand bottlenecks and optimize your agent’s performance
Before you start
Before you start this tutorial, you should:- Have a Galileo account and API key
- Have Python 3.10+ installed
- Be familiar with LangGraph concepts
- Have a basic understanding of OpenTelemetry
Prerequisites
Install required dependencies
For the sake of jumping right into action — we’ll be starting from an existing Python application.- uv Package Manager: Install uv
- Galileo Account: Sign up for free
- OpenAI API Key: Get your API key
1
Clone the repository
Terminal
2
Install dependencies using uv
Terminal
langgraphfor state graph workflowsopentelemetry-*packages for instrumentationpython-dotenvfor environment variable management
1
Create a free Galileo account
Create a free Galileo account at app.galileo.ai if you haven’t already.
2
Get your API key
- Log into Galileo dashboard and get your API Keys
- Click on your profile/settings
- Generate or copy your API key
3
Create a project
- In the Galileo dashboard, create a new project
- Give it a name like “LangGraph-OTel”
- Note the project name - you’ll use this in your
.envfile
4
Create your .env file
Terminal
5
Edit your .env file with your actual values
.env
- Never commit your
.envfile - it contains your API keys! - Project names are case-sensitive - use exactly what you created in Galileo
- Log streams help organize traces (like folders) - create any name you want
Understand the example
This example demonstrates:- Automatic tracing: OpenInference automatically traces both your LangGraph workflow and OpenAI API calls
- Complex workflow: A three-node pipeline that validates input, calls OpenAI, and formats the response
- Production configuration: Proper authentication and BatchSpanProcessor setup for efficient trace export
- LLM observability: Complete visibility into OpenAI API calls, tokens, and response processing
What are these tools
OpenTelemetry (OTel)
OpenTelemetry is like a diagnostic system for your code. It creates “traces” that show:- What functions/operations ran
- How long each step took
- What data flowed through your system
- Where errors occurred
OpenInference
OpenInference is a specialized version of OpenTelemetry that understands AI frameworks like LangChain and LangGraph. It automatically creates meaningful traces for AI operations without you having to write extra code.Run the example
Run it
Terminal
What you’ll see
The program does several things:1
Configure OpenAI and Galileo authentication
Sets up both OpenAI client and Galileo tracing credentials
2
Apply automatic instrumentation
Instruments both LangGraph workflows and OpenAI API calls
3
Run the astronomy Q&A workflow
Processes the question “what moons did Galileo discover” through a 3-node pipeline
4
Export detailed traces
Sends comprehensive traces to Galileo showing the full LLM interaction
Terminal Output
Understand the traces
You’ll see traces for:astronomy_qa_session: The session-level span grouping all operationsvalidate_input: The first node that validates user inputgenerate_response: The OpenAI API call node with detailed LLM tracesformat_answer: The response formatting and parsing node- OpenAI API spans: Detailed traces of the GPT-3.5-turbo call
- Timing: How long each operation took
- Attributes: Key-value data (like input text)
- Events: Breadcrumb-style log messages
- Relationships: Parent-child span connections
Code structure
Main components
Project Structure
Workflow architecture
The example implements a three-node LangGraph workflow with comprehensive OpenTelemetry tracing: Each node is instrumented with OpenTelemetry spans that capture:- Input parameters as span attributes
- Processing events and milestones
- Execution timing and metadata
OpenTelemetry integration
The updated main.py file is structured into the following steps:1
Imports and Environment Setup
2
Galileo Authentication & OpenTelemetry Configuration
path=null start=31
3
LangGraph Workflow Definition
4
Running the Workflow
Review your traces in Galileo
1
Open Galileo
Go to app.galileo.ai and log in
2
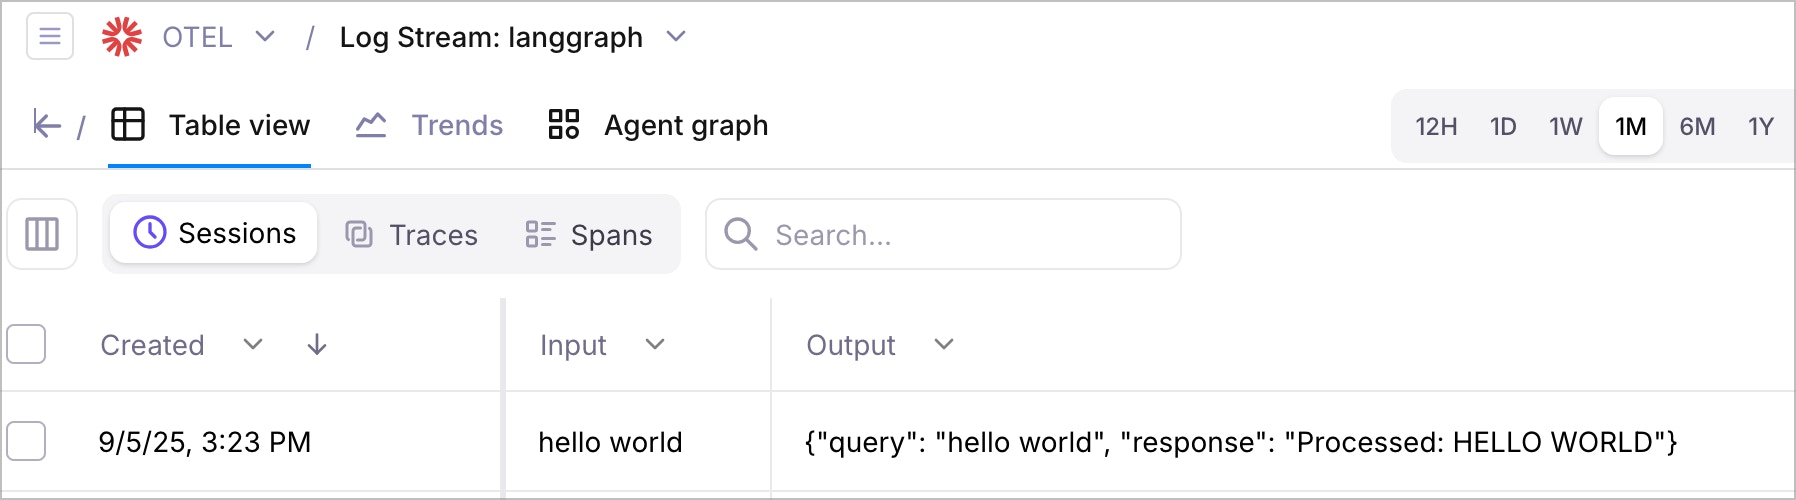
Access your traces
Click on the project you created (e.g., “LangGraph Demo”) and then the relevant Log stream name.
3
Find your traces
Look for traces with names like:
astronomy_qa_sessionvalidate_inputgenerate_responseformat_answer- OpenAI API call traces
4
Explore the timeline
Click on any trace to see:
- Detailed attributes and events
- Hierarchical span relationships
Understand the trace structure
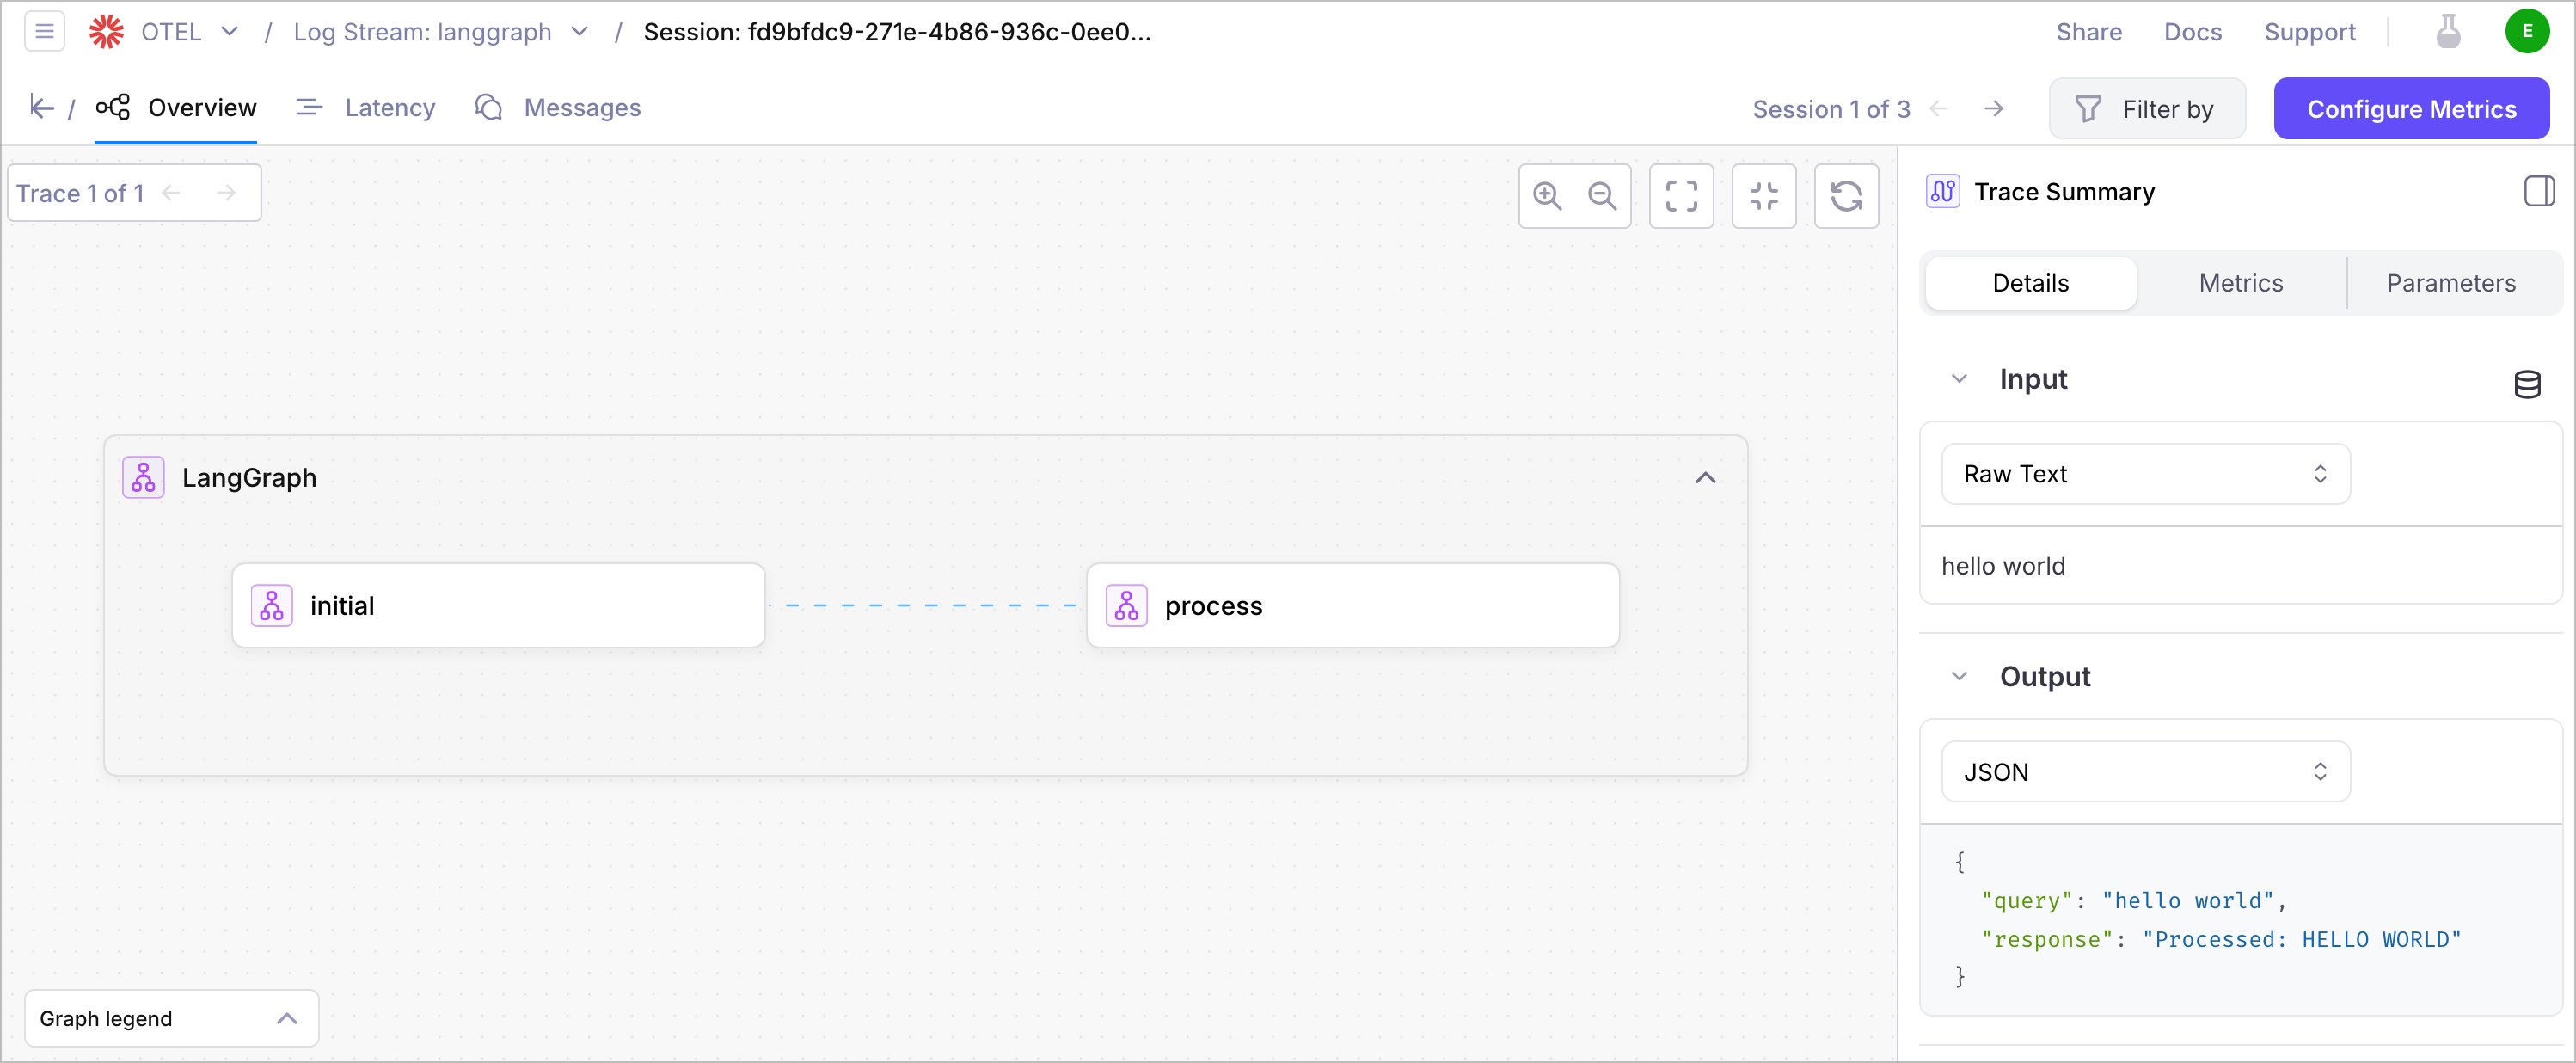
Your traces will show:- Root Span: The main agent execution
- Node Spans: Individual workflow nodes with timing and data
- Custom Spans: Any custom spans you’ve created with attributes and events
- Error Spans: Any errors that occurred during execution
Key metrics to monitor
- Execution Time: How long your agent takes to complete
- Node Performance: Individual node execution times
- Error Rate: Frequency of errors in your agent
- Data Flow: How data moves through your workflow
Troubleshooting
Common issues and solutions
Missing environment variables
Error Output
.env file is properly configured and located in the project root.
Network connectivity
Error Output
- Verify internet connectivity
- Check
GALILEO_CONSOLE_URLif using custom deployment - Ensure firewall allows OTLP exports
Authentication errors
Error Output
- Verify
GALILEO_API_KEYis correct and active - Check project permissions in Galileo dashboard
Import errors
Error Output
uv sync
Debugging tips
1
Enable Console Export
The example includes console span output for local debugging
2
Check Environment Loading
Add print statements to verify
.env variables are loaded3
Validate Network
Test OTLP endpoint connectivity independently
4
Review Logs
Check both console output and Galileo dashboard for error details
Summary
In this cookbook, you learned how to:- Set up OpenTelemetry instrumentation for LangGraph agents using the existing SDK example
- Configure proper tracing with Galileo using environment variables
- Understand the workflow architecture and span structure
- View and analyze traces in the Galileo console
- Troubleshoot common instrumentation issues
- Follow best practices for observability and development
Next steps
Consider exploring these related topics to enhance your observability:OpenTelemetry Guide
Learn more about OpenTelemetry integration with Galileo
LangGraph Experiments
Run experiments with your instrumented LangGraph agents
Multi-Agent Systems
Scale your observability to multi-agent systems
Custom Metrics
Add custom metrics to track agent performance