Getting started with Galileo Observe is really easy. It involves 3 steps:
Create a project
Go to your Galileo Console. Click on the big + icon on the top left, and follow the steps to create your Observe project.
Integrate Galileo in your code
Galileo Observe can integrate via Langchain callbacks, our Python
Logger, or via RESTful APIs.
Choose your Guardrail metrics
Turn on the metrics you want to monitor your system on, select from our Guardrail Metric store or register your
own.
Install the Galileo Client
- Python
- TypeScript
Install the python client via pip install
galileo-observeGetting an API Key
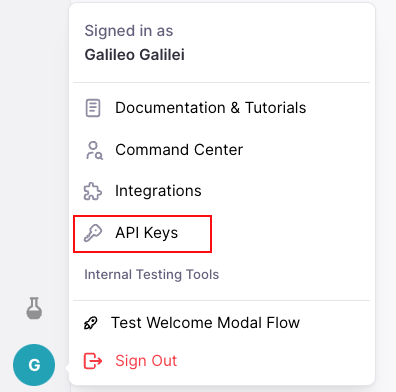
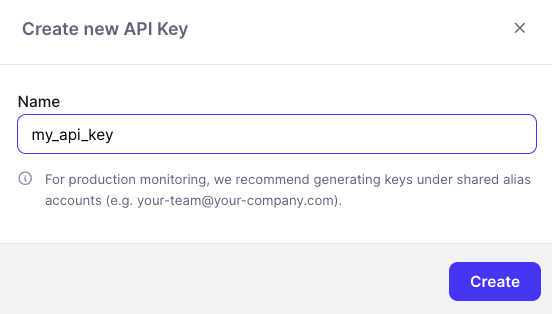
To create an API key:Logging via Client
If you’re not using LangChain, you can use our Python or TypeScript Logger to log your data to Galileo.- Python
- TypeScript
First you can create your ObserveWorkflows object with your existing project.Next you can log your workflow.
Integrating with Langchain
We support integrating into both Python-based and Typescript-based Langchain systems:- Python
- Typescript
Integrating into your Python-based Langchain application is the easiest and recommended route. You can just add The GalileoObserveCallback logs your input, output, and relevant statistics back to Galileo, where additional evaluation metrics are computed.
GalileoObserveCallback(project_name="YOUR_PROJECT_NAME") to the callbacks of your chain invocation.

