What is Data Drift?
In machine learning we generally view data drift as data - e.g. production data - differing from the data used to train a model - i.e. coming from a different underlying distribution. There are many factors that can lead to dataset drift and several ways that drift can manifest. Broadly there are two main categories of data drift: 1) virtual drift (covariate shift) and 2) concept drift.Virtual Drift
Virtual data drift refers to a change in the type of data seen (the feature space) without a change in the relationship between a given data sample and the label it is assigned - i.e. a change in the underlying data distribution P(x) without a change in P(y|x). Virtual drift can manifest in many different forms, such as changing syntactic structure and style (e.g. new ways of asking a particular question to a QA system) or the appearance of novel words, phrases, and / or concepts (e.g. Covid). Virtual drift generally manifests when there is insufficient training data coverage and / or new concepts appear in the real world. Virtual data drift can reveal incorrectly learned decision boundaries, increasing the potential for incorrect, non-trustworthy predictions (especially in the case of an overfit model).Concept shift
In contrast to virtual drift, concept drift refers to a change in the way that labels are assigned for a given data sample - i.e. a change in P(Y|X) without a change to P(X). This typically manifests as the label for a given data sample changing over time. For example, concept drift occurs if there is a change in the labeling criteria / guidelines - certain samples previously labeled Class A should now be labeled Class B.Data Drift in Galileo
Without access to ground truth labels or the underlying labeling criteria, surfacing concept drift is intractable. Therefore, Galileo focuses on detecting virtual data drift. Specifically, we aim to detect data samples that are sufficiently different from the data used during training.Data Drift in Galileo: Detecting data samples that would appear to come from a different distribution than the training data distribution
Data Drift Across Data Split
Data drift as a measure of shifted data distributions is not limited to changes within production data. The characteristics of data drift - an evolving / shifting feature space - can occur for any non-training data split. Therefore, Galileo surfaces data drift errors not only for inference data splits, but also for validation and test splits. We refer to them separately as Drifted vs. Out of Coverage data. Drifted Data: Drifted production data within an inference run. These samples represent the classical paradigm of data drift capturing changes within the real world data distribution. Tracking production data drift is essential for understanding potential changes to model performance in production, the appearance of important new concepts, and indications of a stale training dataset. As production models react to an evolving world, these samples highlight high value samples to be monitored and added to future model re-training datasets. Out of Coverage Data: Drifted validation or test data. These samples capture two primary data gaps:- Data samples that our model fails to properly generalize on - for example due to overfitting or under-representation within the training dataset (generalization drift). These data samples represent concepts that are represented in the training data but show generalization gaps.
- Data concepts that are not represented within the training data and thus the model may struggle to effectively generalize over.
Viewing Drifted Samples
In the Galileo Console, you can view drifted samples either through the Out of Coverage or Drifted data tabs. Since drift compares data distribution, drift is always computed and shown with respect to a reference data distribution - the training dataset. In the embeddings view, we overlay the current split and reference training data embeddings to provide a visual representation of alignment and data gaps (i.e. drifted data) within the embedding space.
Viewing Drifted Samples within an Inference Run
Note: that the 2-dimensional embeddings view is limited in its ability to capture high dimensional embeddings interactions and represents an approximate overlapping of data distributions - i.e. drifted / not drifted data may not always look “drifted” in the embeddings view.
Galileo’s Drift Detection Algorithm
We implement an embedding based, non-parametric nearest neighbor algorithm for detecting out of distribution (OOD) data - i.e. drifted and out of coverage samples. Differentiating algorithm characteristics include:- Embedding Based: Leverage hierarchical, semantic structure encoded in neural network embeddings - particularly realized through working with (large) pre-trained models, e.g. large language models (LLMs)
- Non-parametric: does not impose any distributional assumptions on the underlying embedding space, providing simplicity, flexibility, and generality
- Interpretability: the general simplicity of nearest neighbor based algorithms provides easy interpretability
Transforming the Embedding Space - Core Distance
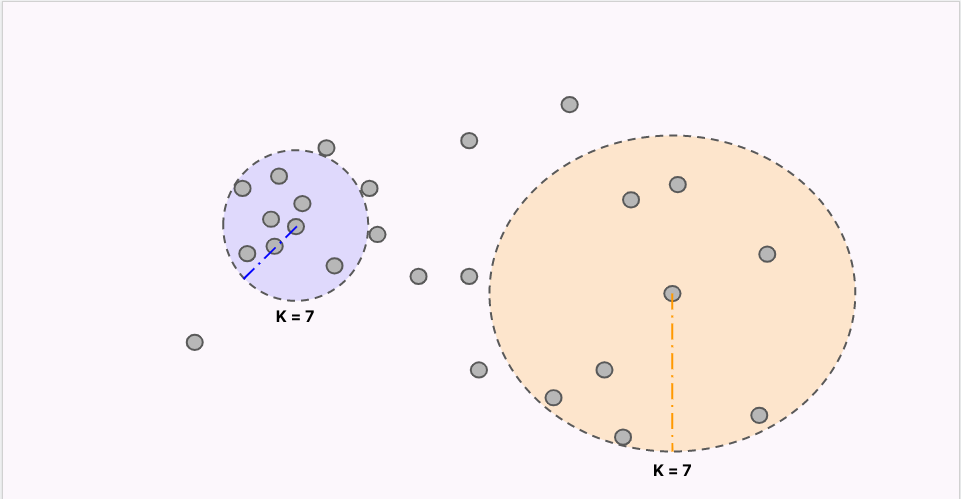
The foundation of nearest neighbor algorithms is a representation of the embedding space through local neighborhood information - defining a neighborhood statistic. Although different methods exist for computing a neighborhood statistic, we utilize a simple and inexpensive estimate of local neighborhood density: K Core-Distance. Used in algorithms such as HDBSCAN [1] __ and _LOF_ [2]_, K C_ore-Distance is computed as the cosine-distance to a samples kth nearest neighbor within the neural network embedding space.K Core-Distance(x) = cosine distance to x’s kth nearest neighbor
The Drift Detection Algorithm
1. Mapping the Embedding Space
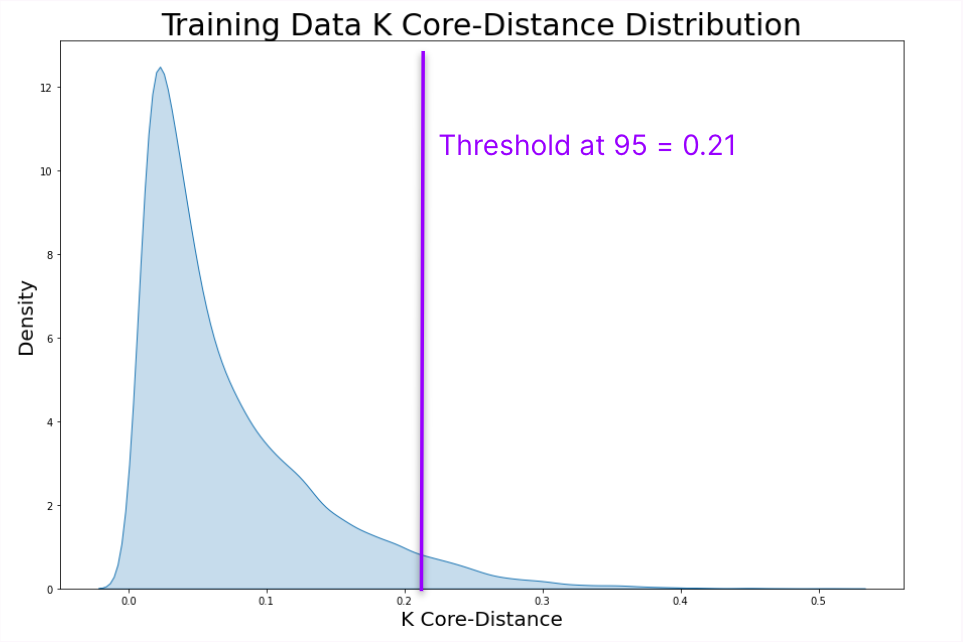
OOD data are computed with respect to a reference distribution - in our case, the model’s training data distribution. Therefore, the first step of the algorithm is mapping the structure of the training embedding data distribution by computing the K Core-Distance for each data sample.Map the training embedding distribution —> K Core-Distance distribution
2. Selecting a Threshold for Data Drift
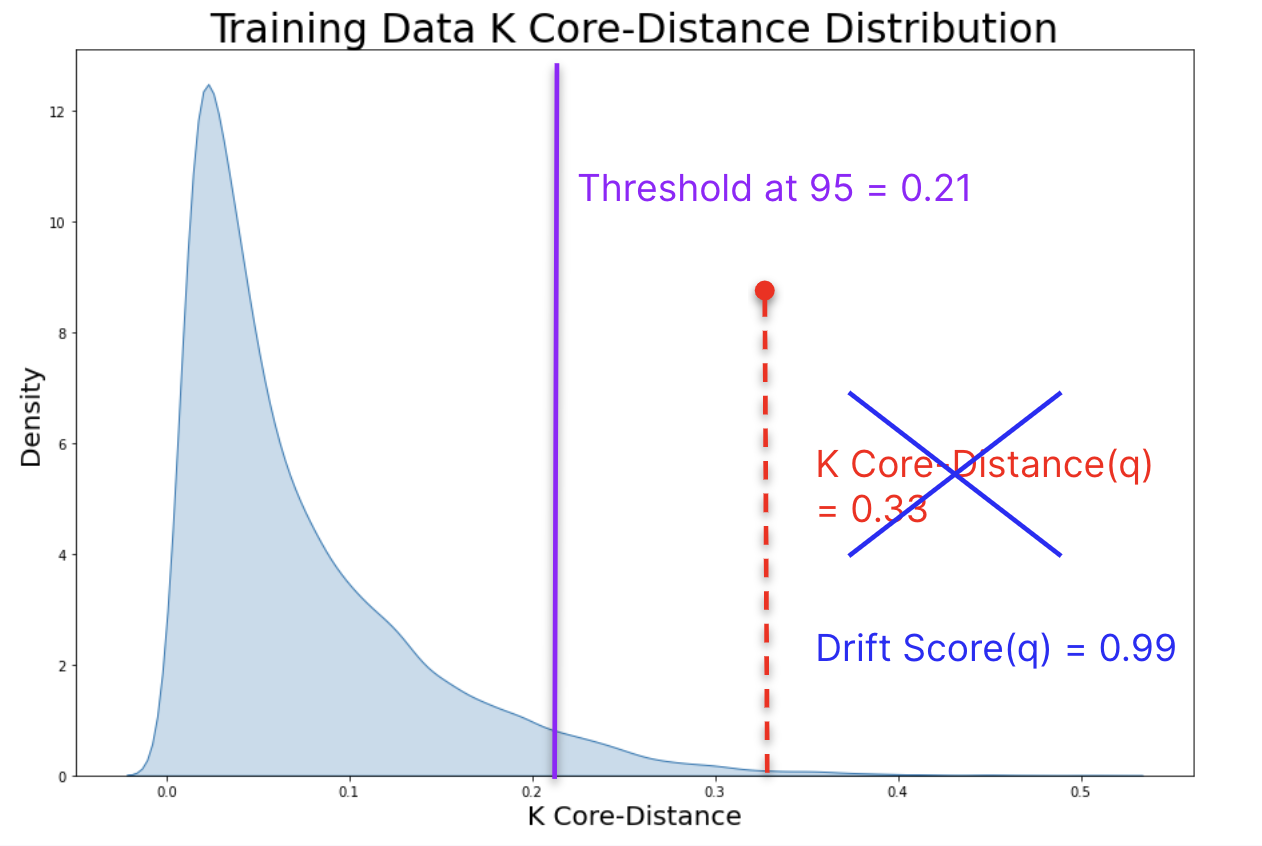
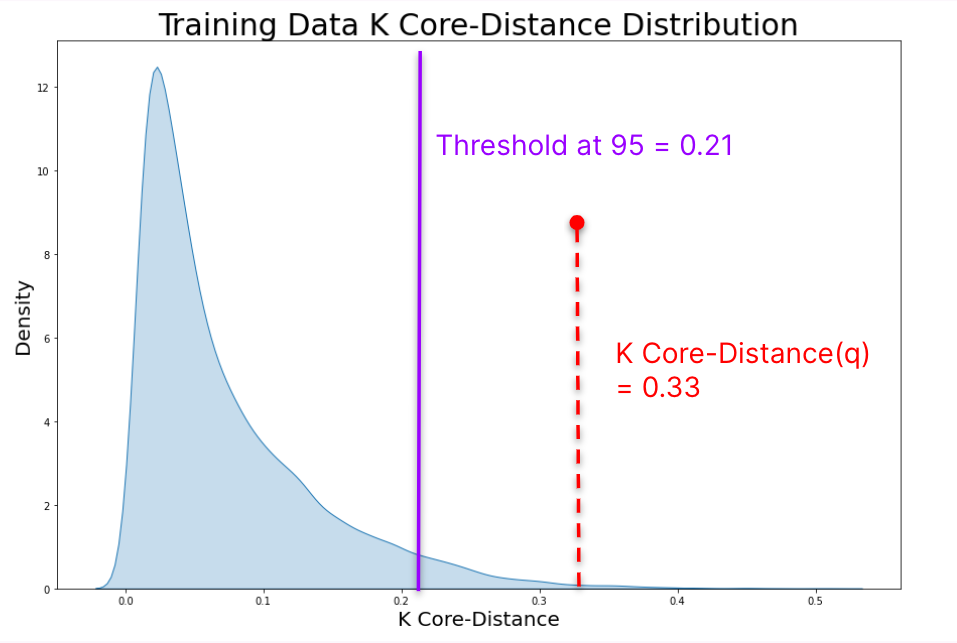
After mapping the reference distribution, we must decide a threshold above which new data should be considered OOD. Selecting a threshold based on the K Core-Distance directly is not generalizable for 2 primary reasons: 1) **** Each dataset has a unique and different K Core-Distance distribution, which in tern influences reason 2) cosine distance is not easily interpretable without context - i.e. a cosine distance of 0.6 has different meanings given two different datasets. For these reasons, we determine a threshold as a threshold at x% precision.e.g. Threshold at 95% precision - The K Core-Distance representing the 95th percentile of the reference distribution
3. Determining that a Sample is Drifted / Out of Coverage
Given a query data sample q, we can quickly determine whether q should be considered OOD.- Embed q within the reference (training) embedding space
- Compute the K Core-Distance of q in the training embedding space.
- Compare q’s K Core-Distance to the threshold determined for the reference distribution.
Interpretability
A major benefits of this algorithm is that it provides interpretability and flexibility. By mapping the reference embedding space to a K Core-Distance distribution, we frame OOD detection as a distribution comparison problem.Given a query sample, how does it compare to the reference distribution?Moreover, by picking a threshold based on a distribution percentile, we remove any dependance on the range of K Core-Distances for a given dataset - i.e. a dataset agnostic mechanism. Drift / Out of Coverage Scores: Building on this distributional perspective, we can compute a per-sample score indicating how out of distribution a data sample is.
Drift / Out of Coverage Score - The percentile a sample falls in with respect to the reference K Core-Distance distribution.Unlike analyzing K Core-Distances directly, our drift / out of coverage score is fully dataset agnostic. For example, consider the example from above. With a K Core-Distance of 0.33 and a threshold of 0.21, we considered the q as drifted. However, in general 0.33 has very little meaning without the context. In comparison, a drift_score of 0.99 captures the necessary distributional context - indicating that q falls within the 99th percentile of the reference distribution and is very likely to be out of distribution.