- Confidence scores are highly model centric. There is high bias towards training performance and very little use of inherent data quality to segregate the good data from the bad (results below)
- Even with powerful pre-trained models, confidence scores are unable to capture nuanced sub-categories of data errors (details below)
- Mislabelled samples (annotation mistakes)
- Boundary samples or overlapping classes
- Outlier samples or Anomalies
- Noisy Input
- Misclassified samples
- Other errors
DEP score calculation
The base calculation behind the DEP score is a hybrid ‘Area Under Margin’ (AUM) mechanism. AUM is the cross-epoch average of the model uncertainty for each data sample (calculated as the difference between the ground truth confidence and the maximum confidence on a non ground truth label). AUM = p(y*) - p(ymax)y^max!=y* We then dynamically leverage K-Distinct Neighbors, IH Metrics (multiple weak learners) and Energy Functions on Logits, to clearly separate out annotator mistakes from samples that are confusing to the model or are outliers and noise. The ‘dynamic’ element comes from the fact that DEP takes into account the level of class imbalance, variability etc to cater to the nuances of each dataset.DEP score efficacy
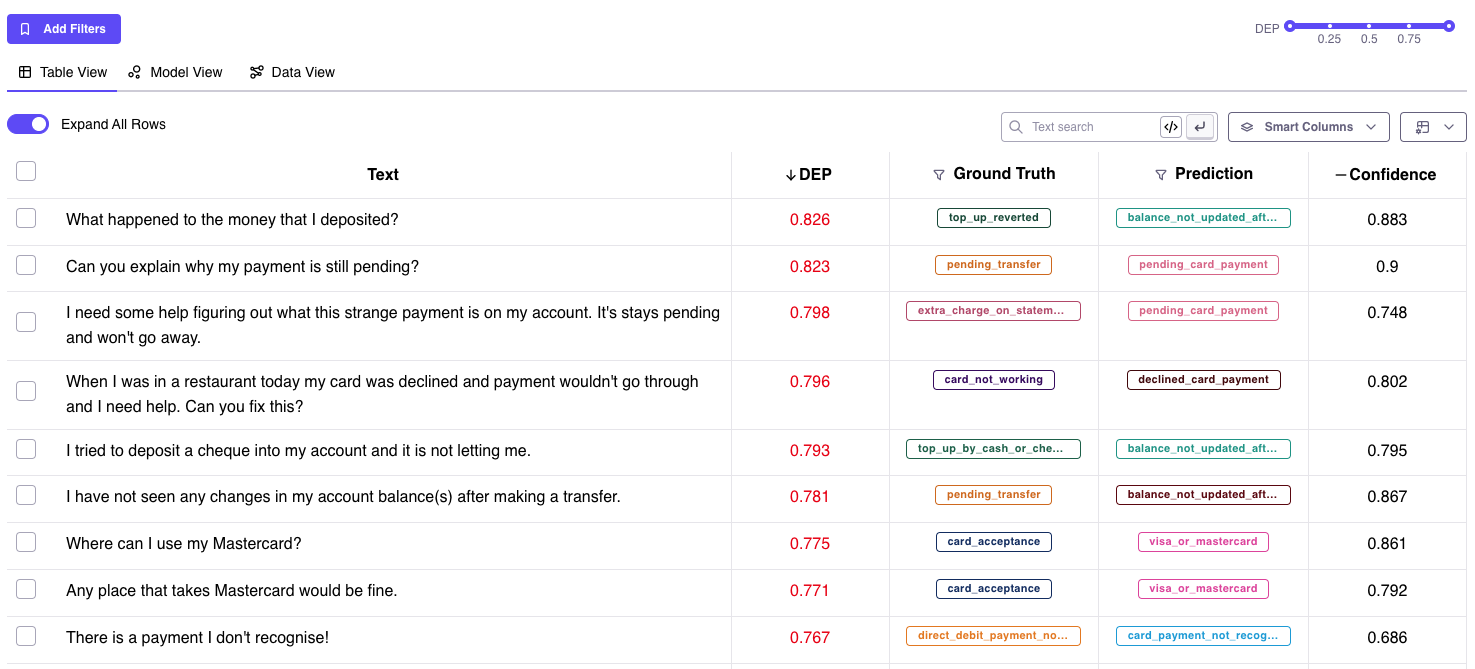
To measure the efficacy of the DEP score, we performed experiments on a public dataset and induced varying degrees of noise. We observed that unlike Confidence scores, the DEP score was successfully able to separate bad data (red) from the good (green). This demonstrates true data-centricity (model independence) of Galileo’s DEP score. Below are results from experiments on the public Banking Intent dataset. The dotted lines indicate a dynamic thresholding value (adapting to each dataset) that segments noisy (red) and clean (green) samples of the dataset.| Galileo DEP score | Model confidence score |
|---|---|
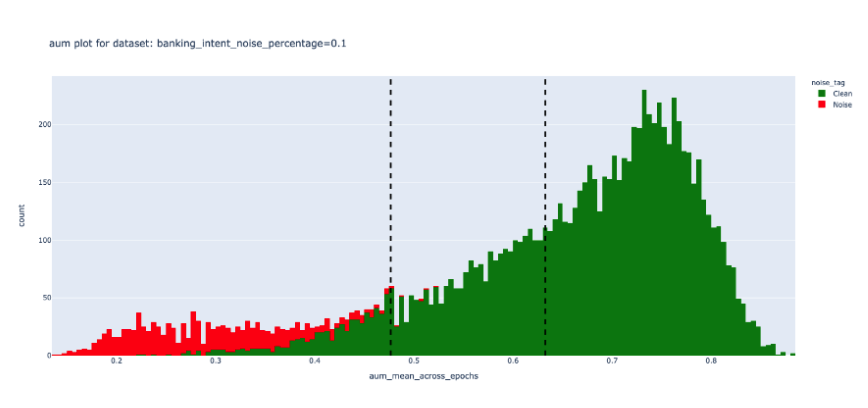 | 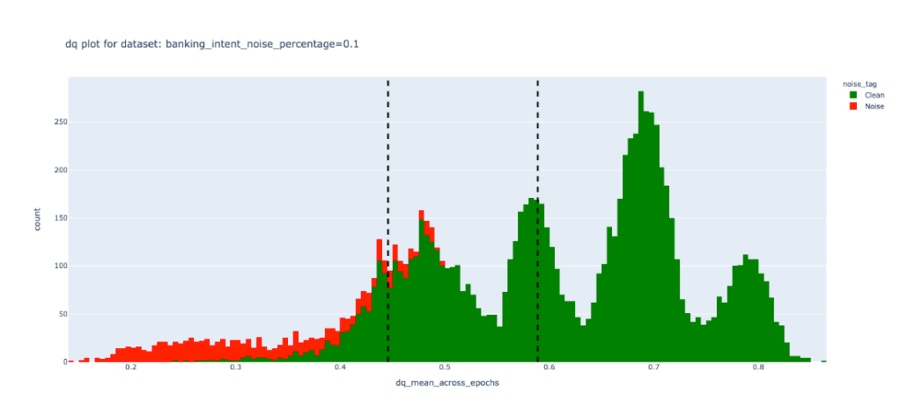 |
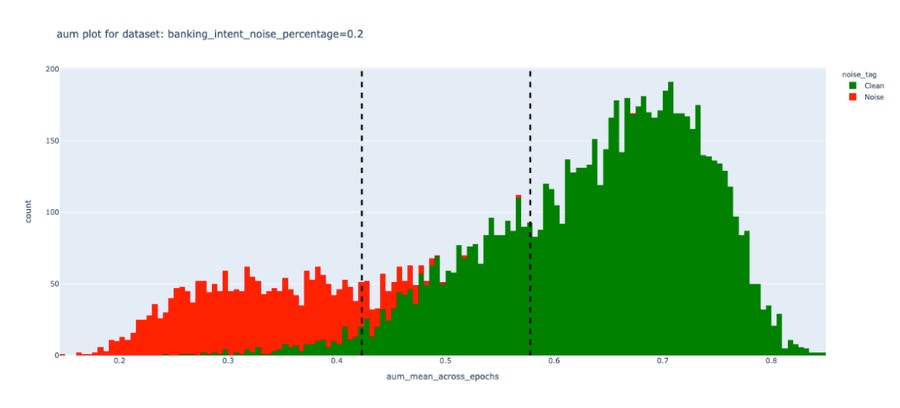 |  |
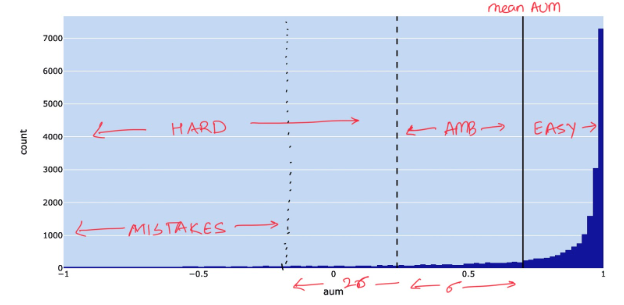
DEP Thresholding
The goal is to plot AUM scores and highlight the mean AUM and mean F1 of the dataset. Two different thresholds, t_easy and t_hard, are marked as follows:- t_easy = mean AUM, so all samples above the mean AUM are considered easy.
- t_hard = [t_mean - t_std, -1], so samples in this range are considered hard or ambiguous.
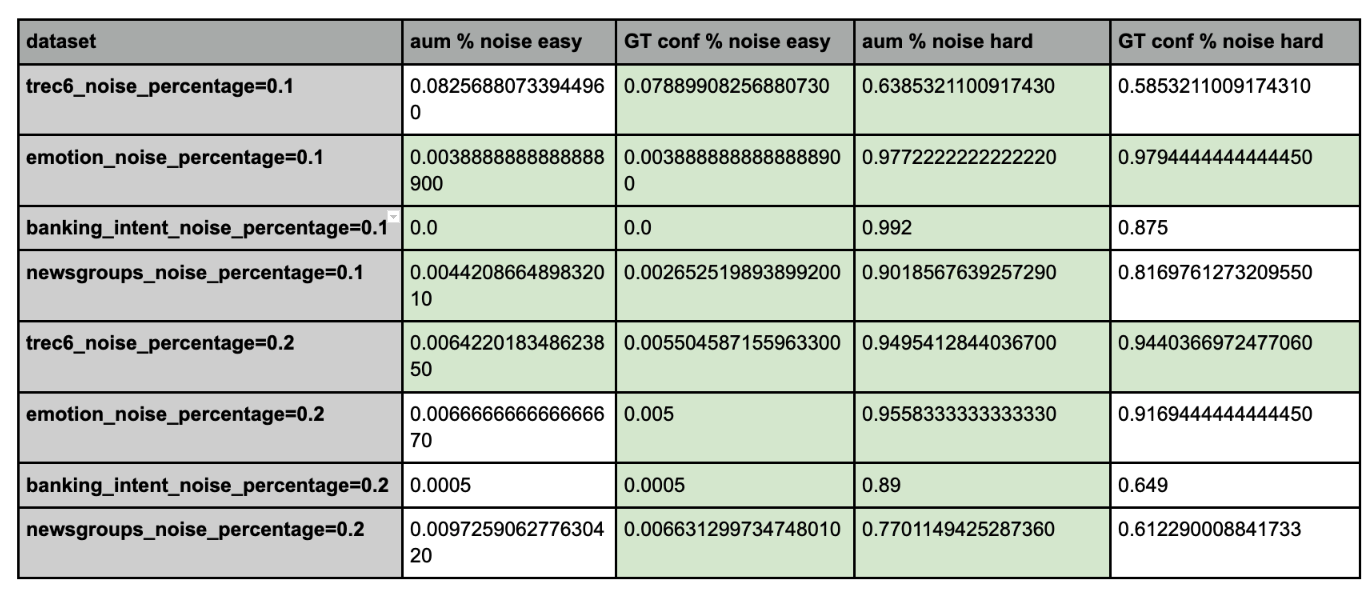
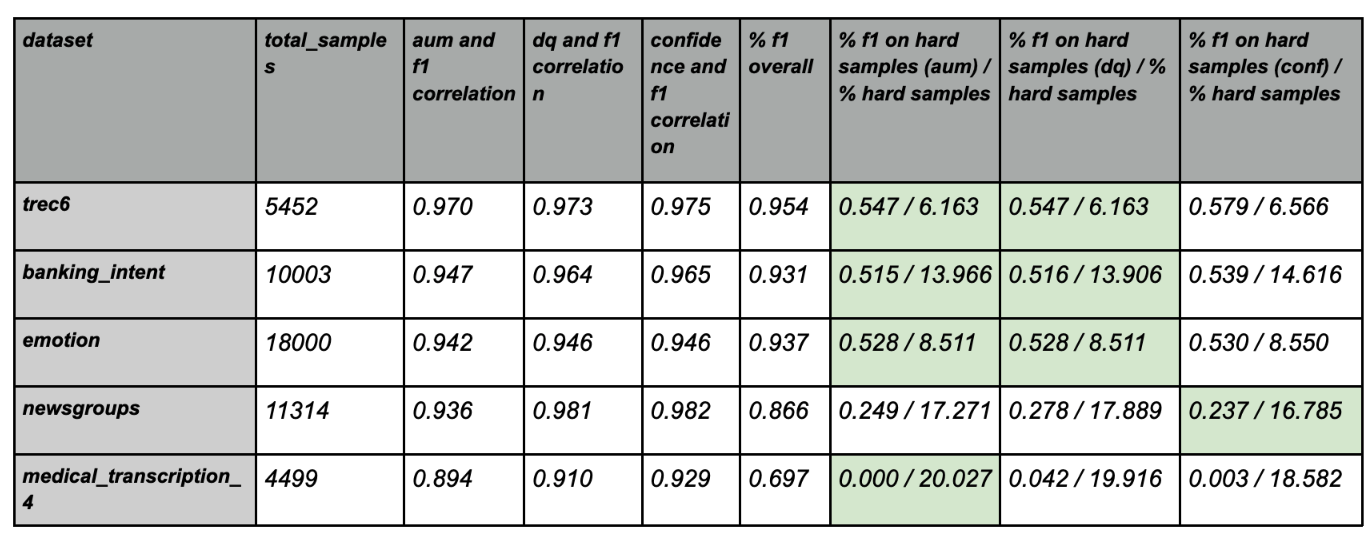
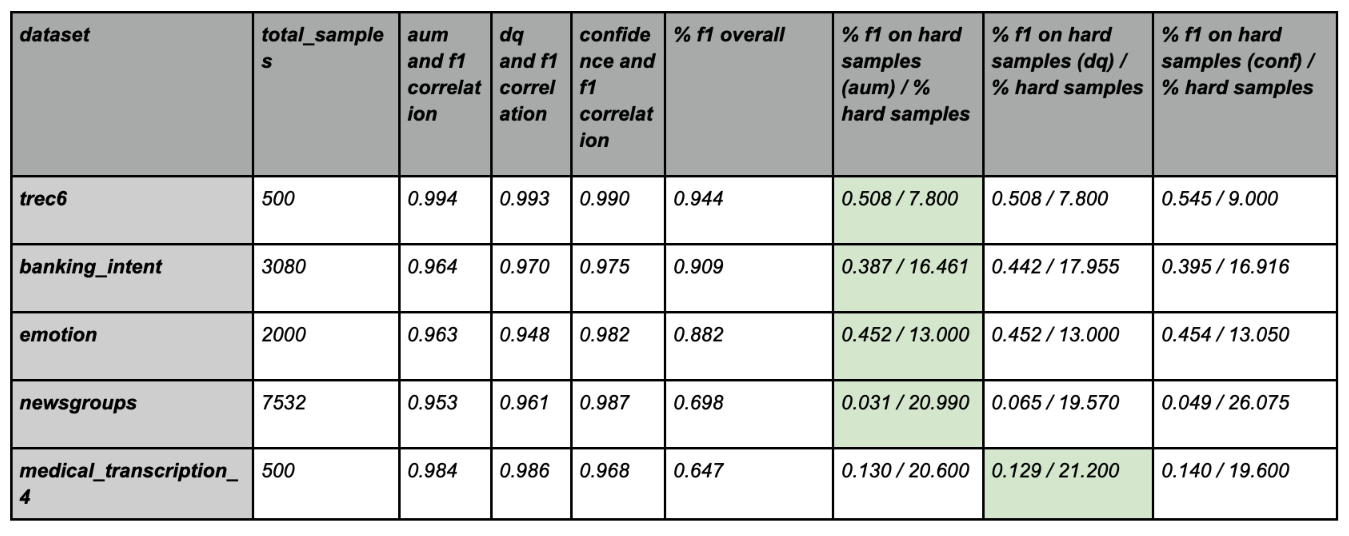
DEP Benchmarks
To ensure DEP calibrations follow the fundamentals of a good ML metric, it should have more noisy samples in hard section and correspondingly less noisy data in easy region. AUM outperforms prediction confidence as well as similar metrics such as Ground Truth confidence as well as Model uncertainty, in being able to surface more noisy samples in the hard category. Below are some benchmarks we calibrated on various well-known and peer reviewed datasets.