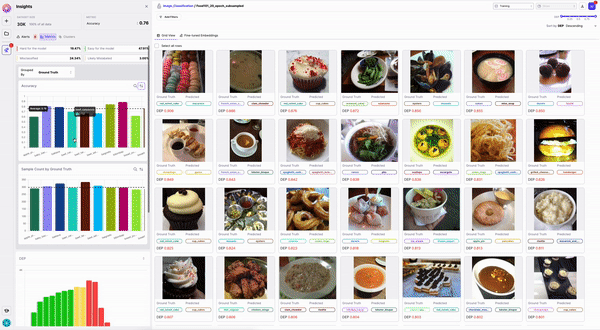
- Overall model and dataset metrics
- Class level model performance
- Class level DEP scores
- Class distributions
- Top most misclassified pairs
- Error distributions
- Class Overlap
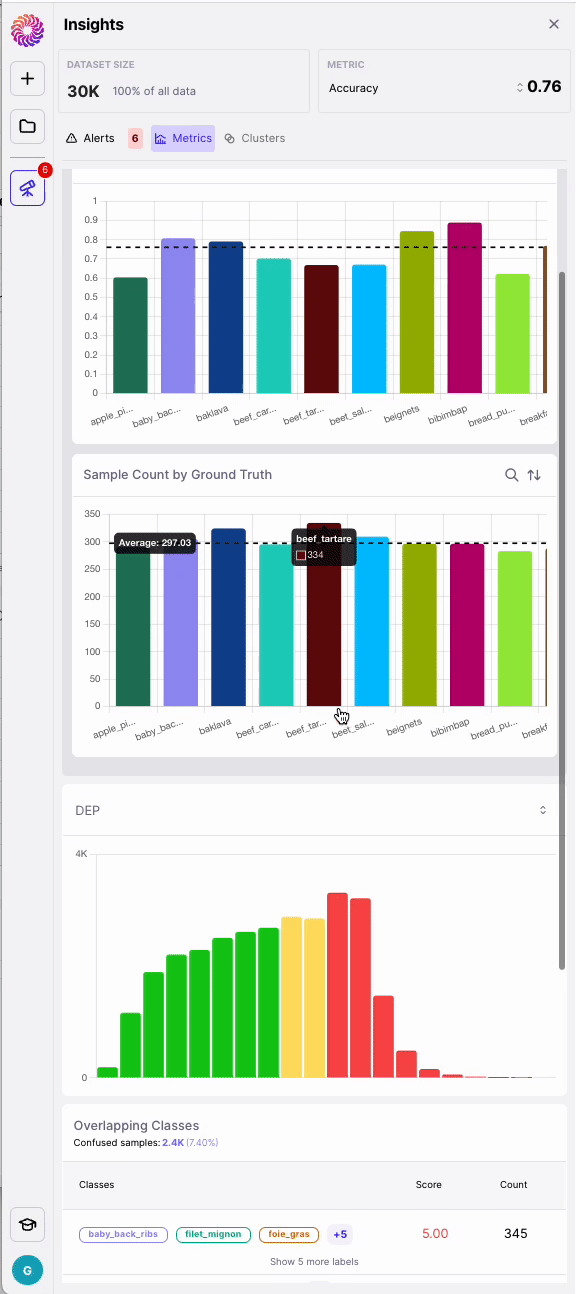
Model and Dataset Metrics
The top of the Insights Panel displays aggregate model performance (default to F1 for NLP, Accuracy, mAP and IOU for Image Classification, Object Detection or Semantic Segmentation) and allow you to select between Precision, Recall, and F1. Additionally, the Insights Panel shows the number of current data samples in scope along with what % of the total data is represented.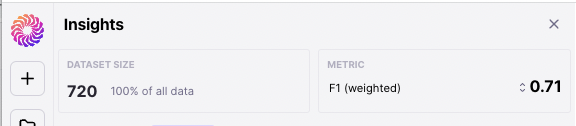
Class Level Model Performance
Based on the model metric selected (F1, Precision, Recall), the “Model performance” bar chart displays class level model performance.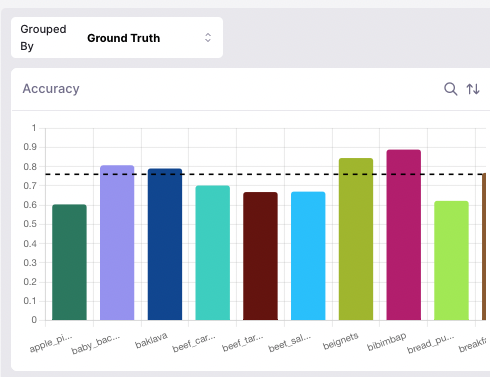
Class Distribution
The Class Distribution chart shows the breakdown of samples within each class. This insights chart is critical for quickly drawing insights about the class makeup of the data in scope and for detecting issues with class imbalance.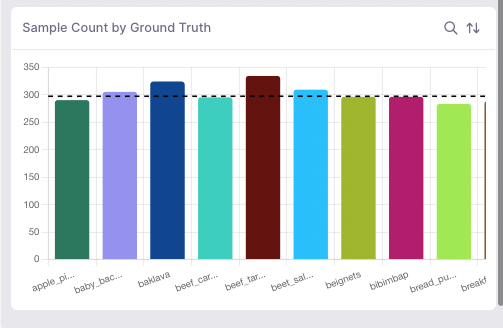
Top most misclassified pairs
At the bottom of the Insights Panel we show the “Top five 5 most misclassified data label pairs”, where each pair shows a gold label, the incorrect prediction label, and the number of samples falling into this misclassified pairing. This insights chart provides a snapshot into the most common mistakes made by the model (i.e. mistaking ground truth label X for prediction label Y).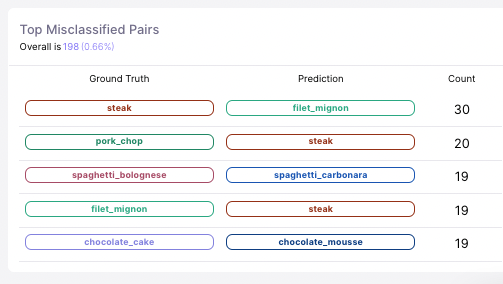
Interacting with Insights Charts
In addition to providing visual insights, each insights chart can also be interacted with. Within the “Model performance”, “Data Error Potential (DEP)”, and “Class distribution” charts selecting one of the bars restricts the data in scope to data withGold Label equal to the selected bar label.
An even more powerful interaction exists in the “Top 5 most misclassified label pairs” panel. Clicking on a row within this insights chart filters for misclassified data matching the gold label and prediction label of the misclassified label pair.