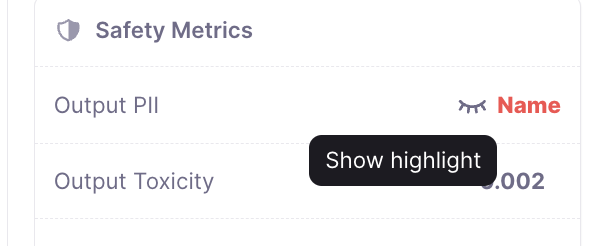
Explainability via Token Highlighting


| Metric | Where to see it |
|---|---|
| PII | Input or Output into LLM or Chat Nodes |
| Prompt Perplexity | Input into LLM or Chat Node |
| Uncertainty | Output of LLM or Chat Node |
| Context Adherence (Luna) | Output of LLM or Chat Node |
| Chunk Relevance (Luna) | Output of Retriever Node |
| Chunk Utilization (Luna) | Output of Retriever Node |
Explainability via Explanations
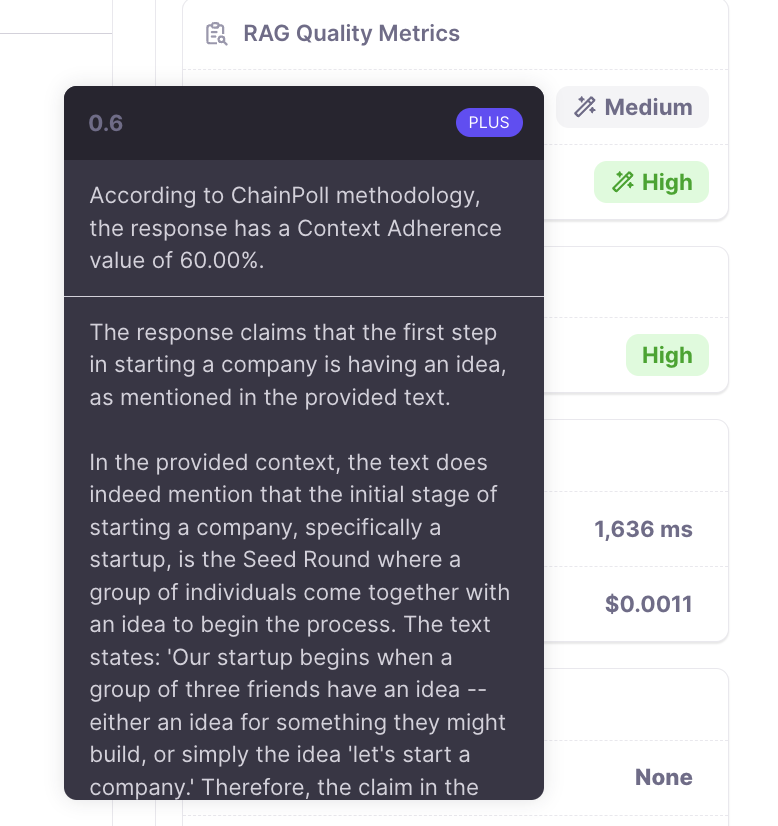
For metrics powered by Chainpoll, we provide an explanation or rationale generated by LLMs. 🪄 next to metric values indicate that this metric has an explanation available. This explanation will include the reasoning the model followed to get to its conclusion. To view the explanation, simply hover over the metric value.