Overview
This guide shows you how to create a custom local metric in Python to use in an experiment. In this example, you will be creating a metric to rate the brevity (shortness) of an LLM’s response based on word count. The sample code to run the experiment will use OpenAI as an LLM. In this guide you will:Before you start
To complete this how-to, you will need:- An OpenAI API key
- A Galileo project
- Your Galileo API key
Install dependencies
To use Galileo, you need to install some package dependencies, and configure environment variables.1
Install Required Dependencies
Install the required dependencies for your app. Create a virtual environment using your preferred method, then install dependencies inside that environment:
2
Create a .env file, and add the following values
This assumes you are using a free Galileo account. If you are using a custom deployment, then you will also need to add the URL of your Galileo Console:
.env
Create your local metric
1
Create a file for your experiment called experiment.py.
2
Create a scorer function
The Scorer Function assigns one of three ranks —
"Terse", "Temperate", or "Talkative", depending on how many words the model outputs. Add this code to your experiment.py file.Python
3
Create the local metric configuration
Here, we tell Galileo that our custom metric returns a
str. We give it a name (“Terseness”), then assign the Scorer. Add this code to your experiment.py file.Python
Prepare the experiment
For this example, we’ll ask the LLM to specify the continent of four countries, encouraging it to be succinct.1
Create a dataset
Create a dataset of inputs to the experiment by adding this code to your
experiment.py file.Python
2
Call the LLM
Next you need a custom function to be called by your experiment. Add this code to your
experiment.py file.Python
3
Add code to run the experiment
Finally, add code to run the experiment using your dataset and custom local metric.
Python
Run the experiment
Now your experiment is set up, you can run it to see the results of your local metric.1
Run the experiment code
Terminal
Terminal
2
View the experiment
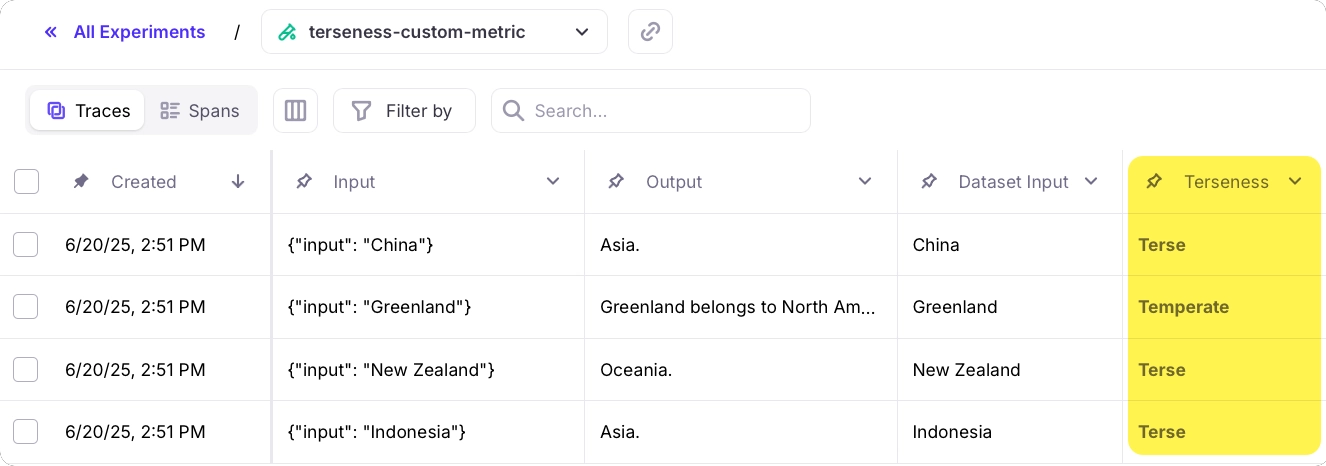
Follow the link in your terminal to view the results of the experiment. This experiment has 4 rows - one per item in the dataset.The new Terseness metric is available in both the Traces table, and from the metrics pane when selecting a row.