Documentation Index
Fetch the complete documentation index at: https://docs.galileo.ai/llms.txt
Use this file to discover all available pages before exploring further.
Overview
This guide shows you how to log spans to Galileo using the GalileoLogger.
The Galileo wrappers and @log decorator are the preferred way to create log traces and spans, but there are times when you need to manually create a trace or a span to give you more granular control over the data you are logging.
This guide shows how to manually log a number of spans when calling an LLM. This pattern can be used for times with the wrapper or decorator are not applicable, such as when using a unsupported LLM SDK such as the Azure AI inference SDK. You will be using OpenAI for this example.
In this guide you will:
- Set up a project with Galileo
- Create a basic app to call OpenAI
- Create a new Galileo logger to log traces and spans to
- Add spans
- Add more details to the trace
Before you start
To complete this how-to, you will need:
Install dependencies
To use Galileo, you need to install some package dependencies, and configure environment variables.
Install Required Dependencies
Install the required dependencies for your app. If you are using Python, create a virtual environment using your preferred method, then install dependencies inside that environment:pip install "galileo[openai]" python-dotenv
Create a .env file, and add the following values
# Your Galileo API key
GALILEO_API_KEY="your-galileo-api-key"

# Your Galileo project name
GALILEO_PROJECT="your-galileo-project-name"

# The name of the Log stream you want to use for logging
GALILEO_LOG_STREAM="your-galileo-log-stream"

# Provide the console url below if you are using a
# custom deployment, and not using the free tier, or app.galileo.ai.
# This will look something like “console.galileo.yourcompany.com”.
# GALILEO_CONSOLE_URL="your-galileo-console-url"

# OpenAI properties
OPENAI_API_KEY="your-openai-api-key"

# Optional. The base URL of your OpenAI deployment.
# Leave this commented out if you are using the default OpenAI API.
# OPENAI_BASE_URL="your-openai-base-url-here"

# Optional. Your OpenAI organization.
# OPENAI_ORGANIZATION="your-openai-organization-here"
This assumes you are using a free Galileo account. If you are using a custom deployment, then you will also need to add the URL of your Galileo Console:GALILEO_CONSOLE_URL=your-Galileo-console-URL
Create a basic app to call OpenAI
Create a file for your application called app.py or app.ts.
Add the following code to call OpenAI to ask a question
import os
import asyncio
import openai
from dotenv import load_dotenv

load_dotenv()

client = openai.AsyncOpenAI(api_key=os.environ.get("OPENAI_API_KEY"))

async def prompt_open_ai(prompt: str) -> str:
    response = await client.chat.completions.create(
        model="gpt-4o-mini",
        messages=[{"role": "user", "content": prompt}],
    )
    return response.choices[0].message.content.strip()

async def main():
    prompt = "Explain the following topic succinctly: Newton's First Law"
    response = await prompt_open_ai(prompt)
    print(response)

if __name__ == "__main__":
    asyncio.run(main())
package.json file:{
"type": "module",
... // Existing contents
}
Run the app to ensure everything is working
You should see a description of Newton’s first law.(.venv) ➜ python app.py
Newton's First Law, also known as the Law of Inertia, states that an object
at rest will stay at rest and an object in motion will stay in motion with
the same speed and in the same direction, unless acted upon by an
unbalanced force. In simpler terms, it means that an object will keep doing
what it's currently doing until a force makes it do something different.
This law is fundamental to understanding motion and forces as it pertains
to physics.
Create a new Galileo logger to log traces and spans to
If you are using the Galileo wrappers or decorators, Galileo automatically create new logging sessions, traces, and spans for you. Seeing as you are doing everything manually, you will need to create a new logger.
Import the Galileo logger
At the top of your file, add an import for the Galileo logger:from galileo import GalileoLogger
Create a logger instance
Create a new Galileo logger instance. In Python, do this at the start of the main function. In TypeScript, do this before the call to promptOpenAI.async def main():
# Create a logger instance
logger = GalileoLogger()
...
This will pick up the project and Log stream from the GALILEO_PROJECT and GALILEO_LOG_STREAM environment variables. You can override these if required by setting the relevant constructor parameters.
Create a new trace
The hierarchy for Log streams is Sessions contain traces, which contain spans. If you start a new trace, a session is created automatically.Create a new trace using the logger by adding the following code just below the declaration of the logger:# Start a new trace
logger.start_trace("Newton's First Law Trace")
Conclude and flush the logger
Once you have finished logging a trace, you need conclude it, passing in the output. Once concluded, you need to flush it to send it to Galileo.Add the following lines to the bottom of the main function in Python, or the end of the app.ts file in TypeScript:logger.conclude(output=response)
logger.flush()
import os
import asyncio
import openai
from dotenv import load_dotenv
load_dotenv()
client = openai.AsyncOpenAI(api_key=os.environ.get("OPENAI_API_KEY"))
async def prompt_open_ai(prompt: str) -> str:
response = await client.chat.completions.create(
model="gpt-4o-mini",
messages=[{"role": "user", "content": prompt}],
)
return response.choices[0].message.content.strip()
async def main():
# Create a logger instance
logger = GalileoLogger()
# Start a new trace
logger.start_trace("Newton's First Law Trace")
prompt = "Explain the following topic succinctly: Newton's First Law"
response = await prompt_open_ai(prompt)
print(response)
logger.conclude(output=response)
logger.flush()
Run the app to log the trace
View the logged trace
From the Galileo Console, open the Log stream for your project. You will see a trace in the traces table.
View details of the trace
Select the trace to view details. Currently it contains no spans, and shows the question and the LLM response as input and output.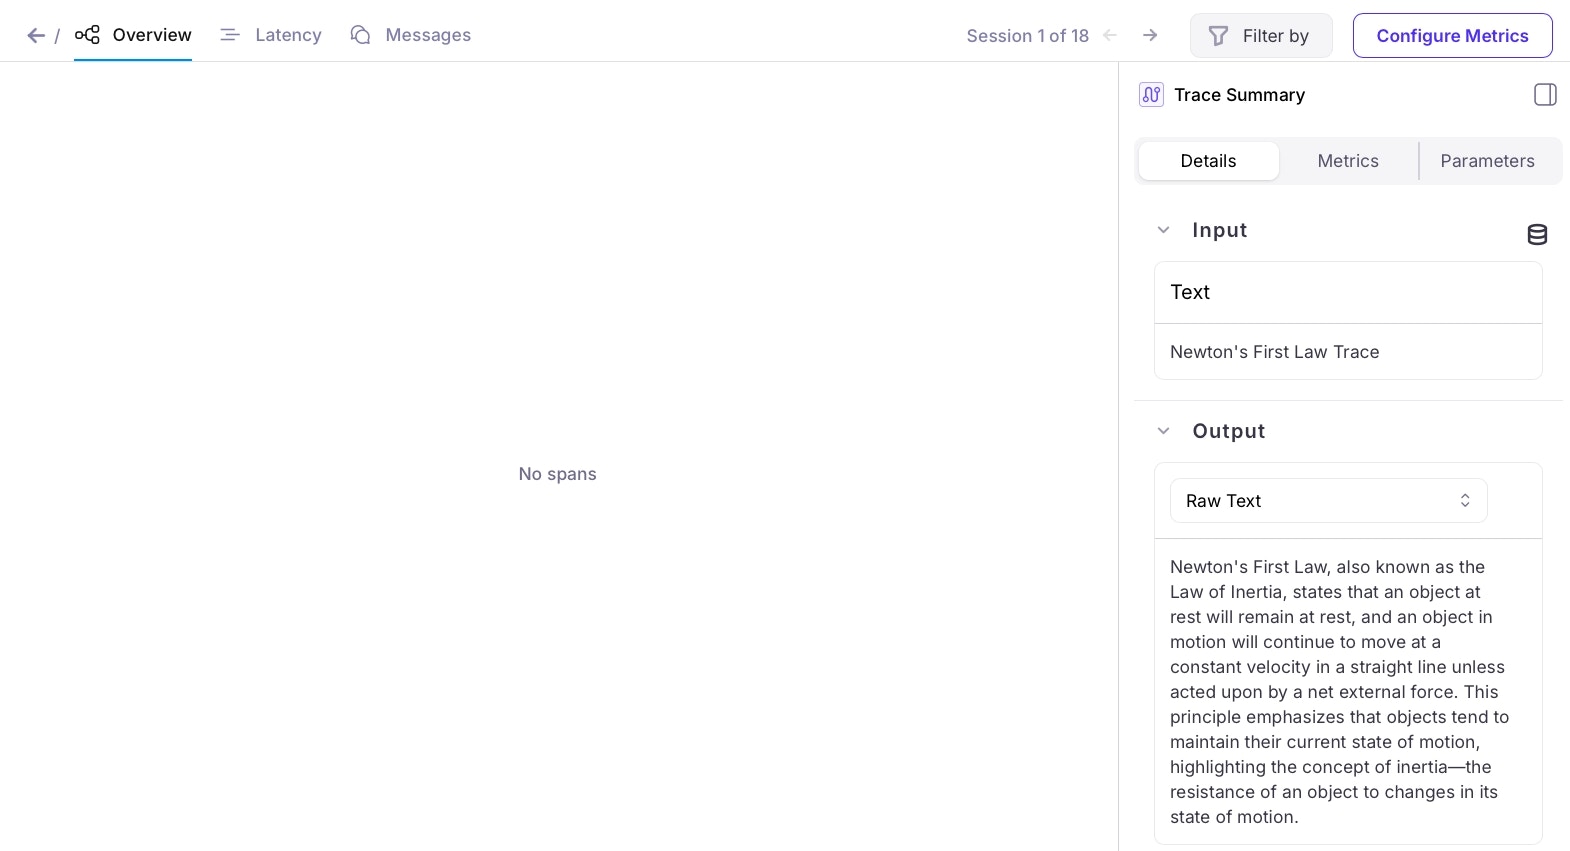
Add spans
The next step is to add spans to the trace. You will be adding an LLM span.
LLM spans can contain a range of details about the LLM call. As well as the input and output text, you can add properties such as the number of tokens used, temperature, and more.
Pass the logger to the prompt OpenAI function
To use the logger, first you need to pass it to the prompt OpenAI function.Update the function definition to the following:async def prompt_open_ai(prompt: str, logger: GalileoLogger) -> str:
...
main function to pass the logger:response = await prompt_open_ai(prompt, logger)
Log the LLM span
After the call to the LLM in the prompt OpenAI function, add the following to create an LLM span. Pass in the prompt, and the response from the LLM, along with details of the model and a name.logger.add_llm_span(
input=prompt,
output=response.choices[0].message.content.strip(),
model="gpt-4o-mini",
name="OpenAI GPT-4o-mini response"
)
Run the app to log the trace
View the logged trace
From the Galileo Console, select the new trace to view details. You will see a single LLM span called “OpenAI GPT-4o-mini response”.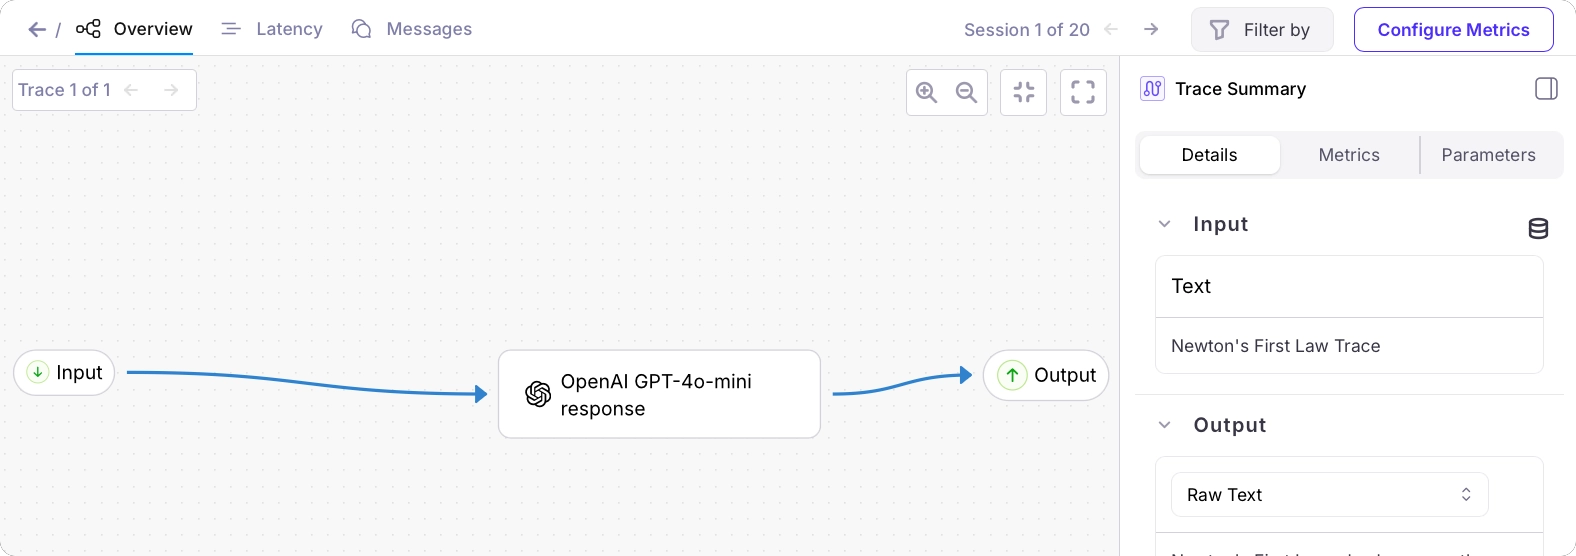
Add more details to the trace
Now you have a span, you can add more details to both the span and the trace, such as duration to help measure latency in your app, and number of tokens to help understand usage and cost.
Add the number of tokens to the LLM span
Update the call that adds the LLM span to include the details of the tokens returned by the call to OpenAI:logger.add_llm_span(
input=prompt,
output=response.choices[0].message.content.strip(),
model="gpt-4o-mini",
name="OpenAI GPT-4o-mini response",
# Add details about the tokens
num_input_tokens=response.usage.prompt_tokens,
num_output_tokens=response.usage.completion_tokens,
total_tokens=response.usage.total_tokens
)
Add the duration of the LLM call
If you time the call to the LLM, you can pass this duration to the LLM span.If you are using Python, add an import for time to the top of the file:Add code to time the LLM call:# Get the start time
start_ns = time.perf_counter_ns()
response = await client.chat.completions.create(
model="gpt-4o-mini",
messages=[{"role": "user", "content": prompt}],
)
# Calculate the duration
duration_ns = time.perf_counter_ns() - start_ns
logger.add_llm_span(
    input=prompt,
    output=response.choices[0].message.content.strip(),
    model="gpt-4o-mini",
    name="OpenAI GPT-4o-mini response",
    # Add details about the tokens
    num_input_tokens=response.usage.prompt_tokens,
    num_output_tokens=response.usage.completion_tokens,
    total_tokens=response.usage.total_tokens,
    # Add the duration
    duration_ns=duration_ns
)
Add the total duration
It can also be helpful to time the entire trace. This allows you to spot bottlenecks in your application.Add similar code to time the code between starting the trace and concluding it. Then pass this to the logger.conclude call:async def main():
# Create a logger instance
logger = GalileoLogger()
# Start a new trace
logger.start_trace("Newton's First Law Trace")
# Get the start time
start_ns = time.perf_counter_ns()
prompt = "Explain the following topic succinctly: Newton's First Law"
response = await prompt_open_ai(prompt, logger)
print(response)
# Calculate the duration
duration_ns = time.perf_counter_ns() - start_ns
logger.conclude(output=response, duration_ns=duration_ns)
logger.flush()
Run the app to log the trace
View the details of the logged trace
From the Galileo Console, select the new trace to view details. In the Metrics tab you will see the latency. Select the LLM span to see details of that span.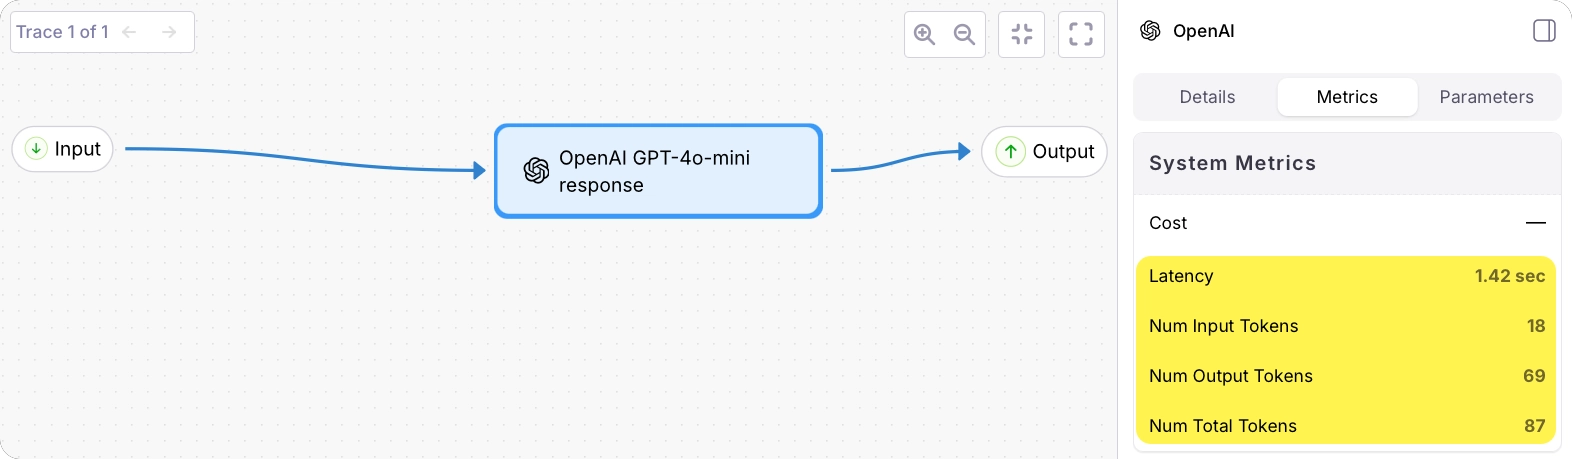
See also

